Some of our customers are using Warp 10 as an IT monitoring platform. Warp 10 is sized to handle deep history, very large infrastructures at any scale, and obviously, small ones. In this post, I will show you how to build a simple IT monitoring system with Warp 10, Telegraf, and Discovery.
Setting up Warp 10
Either you decide to install your own Warp 10, or you can use our Sandbox. In this post, I will use our Sandbox.
Go to https://sandbox.senx.io/ and click "Enter Sandbox", that is all.
Copy-paste somewhere your read/write tokens, we will need them later.
Setting up Telegraf
Download and/or install Telegraf on your server/Raspberry/whatever and edit the config file. On Ubuntu servers, it is located here: /etc/telegraf/telegraf.d/telegraf.conf
Uncomment some parts:
...
[[outputs.warp10]]
  prefix = "telegraf."
  # URL of the Warp 10 server
  warp_url = "https://sandbox.senx.io"
#   # Write token to access your app on Warp 10
   token = "<your write token"

...

[[inputs.cpu]]
  ## Whether to report per-cpu stats or not
  percpu = true
  ## Whether to report total system cpu stats or not
  totalcpu = true
  ## If true, collect raw CPU time metrics
  collect_cpu_time = false
  ## If true, compute and report the sum of all non-idle CPU states
  report_active = false
[[inputs.disk]]
  ## By default stats will be gathered for all mount points.
  ## Set mount_points will restrict the stats to only the specified mount points.
  # mount_points = ["/"]

  ## Ignore mount points by filesystem type.
  ignore_fs = ["tmpfs", "devtmpfs", "devfs", "iso9660", "overlay", "aufs", "squashfs"]

...
[[inputs.net]]
#   ## By default, telegraf gathers stats from any up interface (excluding loopback)
#   ## Setting interfaces will tell it to gather these explicit interfaces,
#   ## regardless of status.
#   ##
#   # interfaces = ["eth0"]
#   ##
#   ## On linux systems telegraf also collects protocol stats.
#   ## Setting ignore_protocol_stats to true will skip reporting of protocol metrics.
#   ##
#   # ignore_protocol_stats = false
#   ##

...

# # Read TCP metrics such as established, time wait and sockets counts.
[[inputs.netstat]]
#   # no configuration
Save it and reload Telegraf, ie: sudo service telegraf restart
First WarpScript
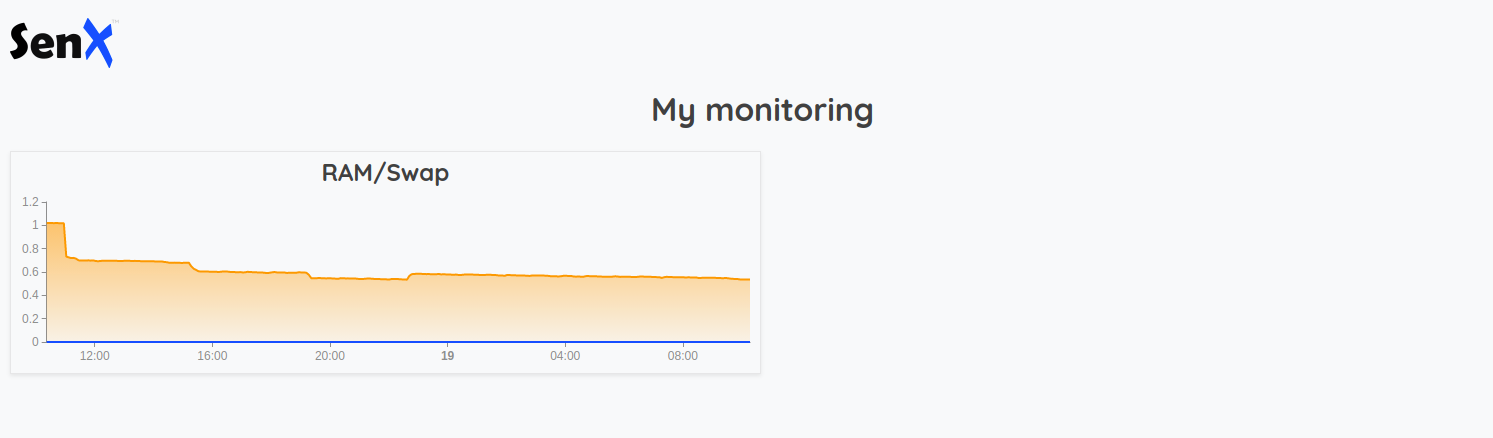
It is time to code our first WarpScript. We will display the RAM/Swap usage over the last 24 hours. Open WarpStudio and choose the Sandbox as a backend. (Learn more about WarpStudio here and here)
// Variables
'your read token' 'token' STORE           // set a variable with your read token
24 h 'duration' STORE
'your host name' 'hname' STORE         // you can find it in /etc/hosts

// Actual code

// Fetch the last 24 hours of collected data for telegraf.mem.free and telegraf.mem.swap_free
[ $token '~telegraf.mem.(free|swap_free)' { 'host' $hname } NOW  $duration ] FETCH 'data' STORE
// compute the mean value over 5 minutes periods
[ $data bucketizer.mean NOW 5 m 0 ] BUCKETIZE 'data' STORE
// Convert bytes to gigabytes
[ $data 1.0 1024.0 1024.0 * 1024.0 * / mapper.mul 0 0 0 ] MAP
You will find the code here. Now, click on "Execute" and then "Dataviz" and you should see something like this:

Discovery dashboard
Now, we will build a discovery dashboard.
Our dashboard needs a skeleton:
You can find the code here and test it directly in WarpStudio. Click on "Execute" and then "WebView", you should see the title.
{
  'title' 'My monitoring'
  'tiles' [
  ]
}
{ 'url' 'https://sandbox.senx.io/api/v0/exec'  }
@senx/discovery2/render
Now, add a new tile in your dashboard, let say, the RAM/Swap usage:
{
  'title' 'RAM/Swap'
  'x' 0 'y' 0 'w' 6 'h' 1                                         // tile position and size
  'options' { 'autoRefresh' 5 }                           // will refresh itself each 5 seconds
  'type' 'area'                                                    // or 'line' or 'bar' as you want
  'macro' <%
    // Variables
    'your read token' 'token' STORE           // set a variable with your read token
    24 h 'duration' STORE
    'your host name' 'hname' STORE         // you can find it in /etc/hosts

    // Actual code

    // Fetch the last 24 hours of collected data for telegraf.mem.free and telegraf.mem.swap_free
    [ $token '~telegraf.mem.(free|swap_free)' { 'host' $hname } NOW  $duration ] FETCH 'data' STORE
    // compute the mean value over 5 minutes periods
    [ $data bucketizer.mean NOW 5 m 0 ] BUCKETIZE 'data' STORE
    // Convert bytes to gigabytes
    [ $data 1.0 1024.0 1024.0 * 1024.0 * / mapper.mul 0 0 0 ] MAP
  %>
}
You can find the code here. You should have something like this:
Now it is time to add the other tiles. But they will have the duration, the token, and the hostname in common… It is better to use dashboard variables:
{
'title' 'My monitoring'
'vars' { // Define global dashboard scoped variables
'token' 'your read token'
'duration' 24 h
'hname' 'your host name'
}
'tiles' [
{
'title' 'RAM/Swap'
'x' 0 'y' 0 'w' 6 'h' 1
'options' { 'autoRefresh' 5 }
'type' 'area'
'macro' <%
// And use your global variables directly in your tiles
[ $token '~telegraf.mem.(free|swap_free)' { 'host' $hname } NOW $duration ] FETCH 'data' STORE
[ $data bucketizer.mean NOW 5 m 0 ] BUCKETIZE 'data' STORE
[ $data 1.0 1024.0 1024.0 * 1024.0 * / mapper.mul 0 0 0 ] MAP
%>
}
]
}
{ 'url' 'https://sandbox.senx.io/api/v0/exec' }
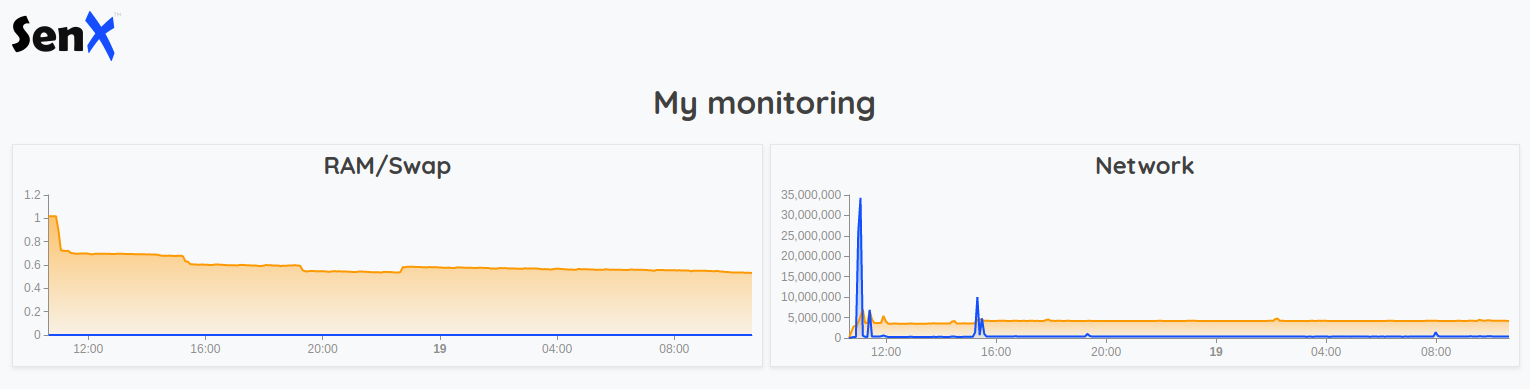
@senx/discovery2/renderNice, isn't it? Now we can quietly add more tiles
Network usage
{
  'title' 'Network'
  'x' 6  'y' 0 'w' 6 'h' 1
  'options' { 'autoRefresh' 5 }
  'type' 'area'
  'macro' <%
    // fetch data for the "ens3" interface, choose yours
    [ $token '~telegraf.net.bytes_(recv|sent)' { 'host' $hname 'interface' 'ens3' } NOW $duration ] FETCH
    // this prevents form server reboot and counters resets
    false RESETS 'data' STORE
    // computes the mean value
    [ $data bucketizer.mean NOW 5 m 0 ] BUCKETIZE 'data' STORE
    // and compute deltas ( n - n-1 )
    [ $data mapper.delta 1 0 0 ] MAP
  %>
}
Disk usage
{
  'title' 'Disks'
  'x' 0 'y' 1 'w' 6 'h' 1
  'type' 'linear-gauge'
  'options' { 'autoRefresh' 5 'gauge' { 'horizontal' true } }
  'macro' <%
    [ $token '~telegraf.disk.(total|free)' { 'host' $hname } NOW -1 ] FETCH 'data' STORE
    // Synchronize timestamps
    [ $data bucketizer.last NOW 0 1 ] BUCKETIZE 'data' STORE
    // group by devices (ie sda1, sda2 and so on)
    $data [ 'device' ] PARTITION 'partitionned' STORE
    [] 'dataArray' STORE
    [] 'params' STORE
    // For each device
    $partitionned  KEYLIST <%
      'device' STORE
      // we build a key/value map
      {
        // Get the time series list
        $partitionned $device GET
        // For each time series for this device
        <% 'gts' STORE
          // Extract a friendly name as the key
          $gts NAME 'telegraf.disk.' '' REPLACE
          // and extract the value
          $gts VALUES REVERSE 0 GET
        %> FOREACH
      } 'vals' STORE
      // add it to the data array
      $dataArray {
        'key'  $device 'device' GET // Device's name
        // Convert bytes to gigabytes
        'value'  $vals 'total' GET $vals 'free' GET - 1024 / 1024 / 1024.0 / 100 * ROUND 100.0 /
      } +! DROP
      // add a specific param for this device and convert bytes to gigabytes
      $params { 'maxValue' $vals 'total' GET  1024 / 1024 / 1024 /  } +! DROP
    %> FOREACH
    // format the output for the widget
    { 'data' $data 'params' $params }
  %>
}
CPU Load
{
'title' 'Load'
'x' 6 'y' 1 'w' 6 'h' 1
'options' { 'autoRefresh' 5 }
'type' 'area'
'macro' <%
// Fetch the las 24 hours of data
[ $token '~telegraf.cpu.usage_(user|nice|system|idle|iowait)' { 'host' $hname } NOW $duration ] FETCH 'data' STORE
// Compute the mean value over 5 minutes periods
[ $data bucketizer.mean NOW 5 m 0 ] BUCKETIZE 'data' STORE
// Extract a subset
[ $data [] '~telegraf.cpu.usage_(user|nice|system|idle|iowait)' filter.byclass ] FILTER 'subset' STORE
// and sum cpu.user, cpu.nice, cpu.system, cpu.idle and cpu.iowait
[ $subset [] reducer.sum ] REDUCE 0 GET 'cpuGTS' STORE
// extract cpu.idle
[ $data [] 'telegraf.cpu.usage_idle' filter.byclass ] FILTER 0 GET 'idleGTS' STORE
// extract cpu.idle and iowait
[ $data [] '~telegraf.cpu.usage_(iowait|idle)' filter.byclass ] FILTER 'subset' STORE
// sum it
[ $subset [] reducer.sum ] REDUCE 0 GET 'iowaitGTS' STORE
// extract idle and system
[ $data [] '~telegraf.cpu.usage_(system|idle)' filter.byclass ] FILTER 'subset' STORE
// sum it
[ $subset [] reducer.sum ] REDUCE 0 GET 'systemGTS' STORE
// a bit more tricky
[ // in a new list
// we compute the CPU load with a MACROREDUCER
[ [ $cpuGTS $idleGTS ] [] <%
'd' STORE
$d 7 GET 0 GET 'cpu' STORE
$d 7 GET 1 GET 'idle' STORE
1000.0 $cpu $idle - * $cpu 5 + / 10 / 'v' STORE
[ $d 0 GET NaN NaN NaN $v ]
%> MACROREDUCER
] REDUCE 0 GET 'CPU' RENAME
// we compute the Disk IO load with a MACROREDUCER
[ [ $iowaitGTS $idleGTS ] [] <%
'd' STORE
$d 7 GET 0 GET 'cpu' STORE
$d 7 GET 1 GET 'idle' STORE
1000.0 $cpu $idle - * $cpu 5 + / 10 / 'v' STORE
[ $d 0 GET NaN NaN NaN $v ]
%> MACROREDUCER
] REDUCE 0 GET 'Disk IO' RENAME
// we compute the System load with a MACROREDUCER
[ [ $systemGTS $idleGTS ] [] <%
'd' STORE
$d 7 GET 0 GET 'cpu' STORE
$d 7 GET 1 GET 'idle' STORE
1000.0 $cpu $idle - * $cpu 5 + / 10 / 'v' STORE
[ $d 0 GET NaN NaN NaN $v ]
%> MACROREDUCER
] REDUCE 0 GET 'System' RENAME
]
%>
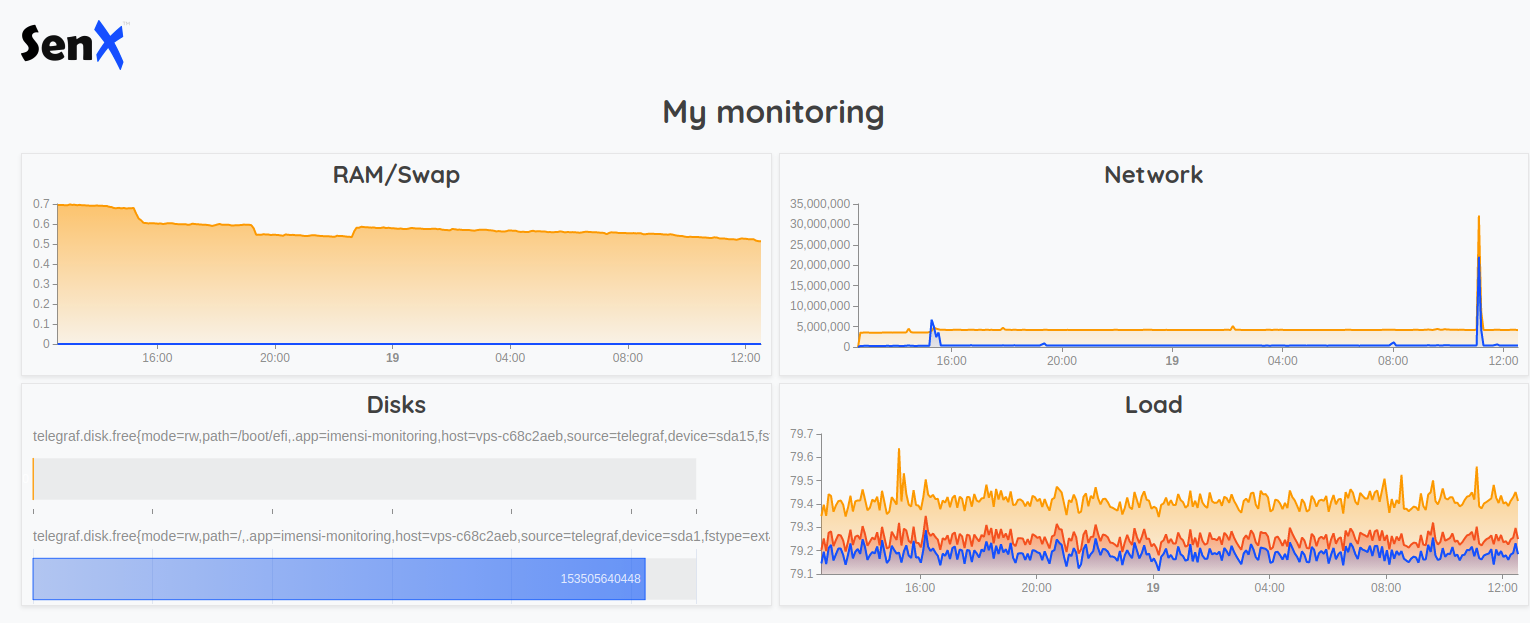
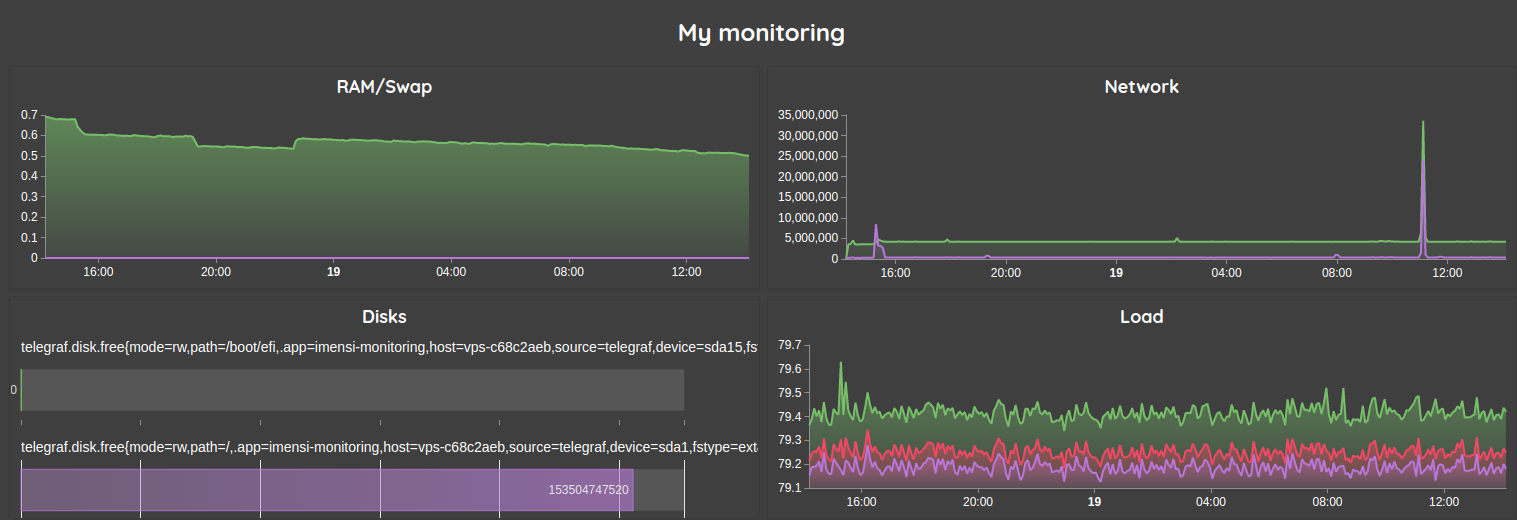
}The Result
Theoretically, you should have something like this:
Pimp my dashboard
Let's add some swag for Grafana lovers:
{
    'title' 'My monitoring'
    'vars' {
        'token' 'your read token'
        'duration' 24 h
        'hname' 'your host name'
        }
        'options' {
             'scheme' 'CHARTANA'
             'customStyles' {
                 '.discovery-dashboard-main'
                 <'
          font-size       : 12px;
          line-height     : 1.52;
                  background: #404040 !important;
          color                          : #FFFFFF;
          --wc-split-gutter-color            : #404040;
          --warp-view-pagination-bg-color    : #343a40 !important;
          --warp-view-pagination-border-color: #6c757d;
          --warp-view-datagrid-odd-bg-color  : rgba(255, 255, 255, .05);
          --warp-view-datagrid-odd-color     : #FFFFFF;
          --warp-view-datagrid-even-bg-color : #212529;
          --warp-view-datagrid-even-color    : #FFFFFF;
          --warp-view-font-color             : #FFFFFF;
          --warp-view-chart-label-color      : #FFFFFF;
          --gts-stack-font-color             : #FFFFFF;
          --warp-view-resize-handle-color    : #111111;
          --warp-view-chart-legend-bg        : #000;
          --gts-labelvalue-font-color        : #ccc;
          --gts-separator-font-color         : #FFFFFF;
          --gts-labelname-font-color         : rgb(105, 223, 184);
          --gts-classname-font-color         : rgb(126, 189, 245);
          --warp-view-chart-legend-color     : #FFFFFF;
          --wc-tab-header-color              : #FFFFFF;
          --wc-tab-header-selected-color     : #404040;
          --warp-view-tile-background        : #3A3C4622;
      '>
          }
        }
        'tiles' [
...
        ]
}
Standalone version
Finally, if you want a standalone HTML file to display this dashboard, simply copy/paste the above script in the skeleton below, be sure to remove the 2 last lines :{ 'url' 'https://sandbox.senx.io/api/v0/exec' }@senx/discovery2/render
<html>
<head>
  <title>My dashboard</title>
  <style>
    body {
        padding: 0;
        margin: 0;
    }
    discovery-dashboard {
        color: transparent;
    }
  </style>
</head>
<body>
<discovery-dashboard url="https://sandbox.senx.io/api/v0/exec">
{
  'title' 'My monitoring'
  'vars' {
    'token' 'your read token'
    'duration' 24 h
    'hname' 'your host name'
  }
  'options' {
    'scheme' 'CHARTANA'
    'customStyles' {
        '.discovery-dashboard-main'
        <'
font-size                          : 12px;
line-height                        : 1.52;
background                         : #404040 !important;
color                              : #FFFFFF;
--wc-split-gutter-color            : #404040;
--warp-view-pagination-bg-color    : #343a40 !important;
--warp-view-pagination-border-color: #6c757d;
--warp-view-datagrid-odd-bg-color  : rgba(255, 255, 255, .05);
--warp-view-datagrid-odd-color     : #FFFFFF;
--warp-view-datagrid-even-bg-color : #212529;
--warp-view-datagrid-even-color    : #FFFFFF;
--warp-view-font-color             : #FFFFFF;
--warp-view-chart-label-color      : #FFFFFF;
--gts-stack-font-color             : #FFFFFF;
--warp-view-resize-handle-color    : #111111;
--warp-view-chart-legend-bg        : #000;
--gts-labelvalue-font-color        : #ccc;
--gts-separator-font-color         : #FFFFFF;
--gts-labelname-font-color         : rgb(105, 223, 184);
--gts-classname-font-color         : rgb(126, 189, 245);
--warp-view-chart-legend-color     : #FFFFFF;
--wc-tab-header-color              : #FFFFFF;
--wc-tab-header-selected-color     : #404040;
--warp-view-tile-background        : #3A3C4622;
      '>
    }
  }
  'tiles' [
...
  ]
}
</discovery-dashboard>
<script nomodule src="https://unpkg.com/@senx/discovery-widgets/dist/discovery/discovery.js"></script>
<script type="module" src="https://unpkg.com/@senx/discovery-widgets/dist/discovery/discovery.esm.js"></script>
</body>
</html>
Going further
You can also add a hostname chooser (like the country chooser explained here) and a time period chooser (same variable event mechanism as the previous one but with the input:date-range tile:
{
    'title' 'Period'
    'x' 0  'y' 0 'w' 2 'h' 1
    'type' 'input:date-range'
    'macro' <%
      { 'data' [ NOW 10 d - NOW ] 'events' [
        { 'type' 'variable' 'tags' 'dateSelection' 'selector' 'dateSelection' }
      ] }
    %>
}
More articles about Discovery:
- Santa asset tracking and delivery service
- Covid Tracker built with Warp 10 and Discovery
- Using Warp 10 as a map tile server for Discovery
Feel free to share with us screenshots of your artwork on Twitter.
Read more
Discovery Tips&Tricks #4 - Production-ready! 🚀
Saving and processing sensor data with Node-RED and WarpScript
n8n & Warp 10 - Automate your time series manipulations

Senior Software Engineer