Discovery is a powerful dashboarding tool and allows for totally custom data visualization. Learn how to create a Discovery plugin.
Since Discovery-widgets 1.1.4, we integrate a plugin system in order to add your own tiles which will interact with Discovery Dashboards. It becomes quite easy to create a custom chart.
Tiles are based on Web Components, so your plugin must also be a Web Component.
In this tutorial, we will build a radar chart based upon the nice ChartJS library and embed it into a StencilJS Web Component.
| What exactly is Discovery? Learn more |
Bootstrap the project
In a new folder, we will scaffold a StencilJS Web Component:
$ npm init stencil

$ cd discovery-plugin-radar
$ npm install
$ rm -fr src/components/*
$ npm install chart.js
$ npm install -D @senx/discovery-widgets
Bootstrap your component
$ npm run generate
In order to parse your package.json to add some of its fields in your plugin definition, edit tsconfig.ts:
{
  "compilerOptions": {
    "allowSyntheticDefaultImports": true,
    "allowUnreachableCode": false,
    [ ... ]
    "jsxFactory": "h",
    "resolveJsonModule": true
  },
[ ... ]
}
Just add "resolveJsonModule": true to the compilerOptions.
To facilitate the packaging of your component, edit stencil.config.ts:
import { Config } from '@stencil/core';

export const config: Config = {
  namespace: 'discovery-plugin-radar',
  globalScript: './src/plugin.ts',
  outputTargets: [
    {
      type: 'dist',
      esmLoaderPath: '../loader',
    },
    {
      type: 'dist-custom-elements',
    },
    {
      type: 'docs-readme',
    },
    {
      type: 'www',
      serviceWorker: null, // disable service workers
    },
  ],
};
We add a globalScript field to allow your component to be registered by Discovery.
Create src/plugin.ts to allow your component to be registered:
import {PluginDef, PluginManager} from "@senx/discovery-widgets";
import * as pack from "../package.json"

export default () => {
  PluginManager.getInstance().register(new PluginDef({
    type: 'radar',
    name: pack.name,
    tag: 'discovery-plugin-radar',
    author: pack.author,
    description: pack.description,
    version: pack.version,
  }));
}
This code will be called when the browser loads the component. It creates a plugin definition:
- type: the chart type that you will use in your dashboards tiles definition (must be unique across Discovery)
- name: we fetch the package name as declared in package.json, it will act as a unique key to register your plugin
- tag: the HTML tag corresponding to your component
- author: we fetch the author field of the package.json file (do not forget to fill it)
- description: we fetch the description field of the package.json file (do not forget to fill it)
- version: your package version
The radar component
Stencil should have created 2 files:
- src/components/discovery-plugin-radar/discovery-plugin-radar.css
- src/components/discovery-plugin-radar/discovery-plugin-radar.tsx
Edit src/components/discovery-plugin-radar/discovery-plugin-radar.css:
:host {
  display: block;
  width: 100%;
  height: 100%;
}

.chart-container {
  width: 100%;
  height: 100%;
}
StencilJS also supports Less, Sass, Stylus, and PostCss (Learn more about StencilJS plugins).
Edit src/components/discovery-plugin-radar/discovery-plugin-radar.tsx.
Start with the imports:
import { ChartType, ColorLib, DataModel, DiscoveryEvent, GTSLib, Logger, Param, Utils } from '@senx/discovery-widgets';
import { Component, Element, Event, EventEmitter, h, Listen, Method, Prop, State, Watch } from '@stencil/core';
import { Chart, registerables } from 'chart.js';
Now, have a look at the mandatory parts of a Discovery plugin.
The attributes
As it is a Web Component, you can define custom HTML attributes. Some of them are mandatory for a Discovery Plugin:
  @Prop() result: DataModel | string;                 // mandatory, will handle the result of a Warp 10 script execution
  @Prop() type: ChartType;                            // optionnal, to handle the chart type if you want to handle more than one
  @Prop() options: Param | string = new Param();      // mandatory, will handle dashboard and tile option
  @State() @Prop() width: number;                     // optionnal
  @State() @Prop({ mutable: true }) height: number;   // optionnal, mutable because, in this tutorial, we compute it
  @Prop() debug: boolean = false;                     // optionnal, handy if you want to use the Discovery Logger
The events
As it will interact with other tiles, your component needs to emit events:
@Event() draw: EventEmitter<void>; // mandatoryOther inner variables
  @Element() el: HTMLElement;

  @State() innerOptions: Param;               // will handle merged options
  @State() innerResult: DataModel;            // will handle the parsed execution result

  private LOG: Logger;                        // The Discovery Logger
  private divider: number = 1000;             // Warp 10 time unit divider
  private chartElement: HTMLCanvasElement;    // The chart area
  private innerStyles: any = {};              // Will handle custom CSS styles for your tile
  private myChart: Chart;                     // The ChartJS instance
Watchers
Watchers will be called each time an attribute is updated. Those are mandatory:
  /*
   * Called when the result is updated
   */
  @Watch('result') // mandatory
  updateRes(newValue: DataModel | string, oldValue: DataModel | string) {
    if (JSON.stringify(newValue) !== JSON.stringify(oldValue)) {
      this.innerResult = GTSLib.getData(this.result);
      setTimeout(() => this.drawChart());   // <- we will see this function later
    }
  }

  /*
   * Called when the options are updated
   */
  @Watch('options') // mandatory
  optionsUpdate(newValue: string, oldValue: string) {
    if (JSON.stringify(newValue) !== JSON.stringify(oldValue)) {
      if (!!this.options && typeof this.options === 'string') {
        this.innerOptions = JSON.parse(this.options);
      } else {
        this.innerOptions = { ...this.options as Param };
      }
      setTimeout(() => this.drawChart());
    }
  }
Public methods
The dashboard can invoke some methods on tiles, some methods are mandatory:
  /*
   * Mandatory
   * Called by Discovery when the component must be resized
   */
  @Method()
  async resize() {
    if (!!this.myChart) {
      this.myChart.resize();
    }
  }

  /*
   * Optionnal
   * Called by Discovery when the component has to export its content to PNG or SVG
   */
  @Method()
  async export(type: 'png' | 'svg' = 'png') {
       // insert your own implementation
  }
Events handler
Those handlers will compute things when an event is trapped by the tile:
  /* Handy if you want to handle Discovery events coming from other tiles */
  @Listen('discoveryEvent', { target: 'window' })
  discoveryEventHandler(event: CustomEvent<DiscoveryEvent>) {
    const res = Utils.parseEventData(event.detail, this.innerOptions.eventHandler);
    if (res.data) {
      this.innerResult = res.data;
      setTimeout(() => this.drawChart());
    }
    if (res.style) {
      this.innerStyles = { ...this.innerStyles, ...res.style as { [k: string]: string } };
    }
  }
Component lifecycle methods
As your component will be loaded in a browser, StencilJS provide handy lifecycle methods (learn more):
  /*
   * Mandatory
   * Part of the lifecycle
   */
  componentWillLoad() {
    Chart.register(...registerables);                                               // ChartJS specific loading
    this.LOG = new Logger(DiscoveryPluginRadar, this.debug); // init the Discovery Logger
    // parse options
    if (typeof this.options === 'string') {
      this.innerOptions = JSON.parse(this.options);
    } else {
      this.innerOptions = this.options;
    }
    // parse result
    this.innerResult = GTSLib.getData(this.result);
    this.divider = GTSLib.getDivider(this.innerOptions.timeUnit || 'us'); // Warp 10 default time unit
    // Get tile dimensions of the container
    const dims = Utils.getContentBounds(this.el.parentElement);
    this.width = dims.w;
    this.height = dims.h;
  }

  /*
   * Mandatory
   * Part of the lifecycle
   */
  componentDidLoad() {
    setTimeout(() => this.drawChart());
  }

  /*
   * Mandatory
   * Render the content of the component
   */
  render() {
    return (
      <div class="chart-container">
        {this.innerResult ? <canvas id="myChart" ref={(el) => this.chartElement = el as HTMLCanvasElement}></canvas> : ''}
      </div>
    );
  }
The logic part
Now, I will show you how to handle the execution result and feed ChartJS with it (learn more about the data structure of ChartJS) :
drawChart() {
    // Merge options
    let options = Utils.mergeDeep<Param>(this.innerOptions || {} as Param, this.innerResult.globalParams) as Param;
    this.innerOptions = { ...options };
    const labels = [];
    const datasets = [];
    // Flatten the data structure and add an id to GTS
    const gtsList = GTSLib.flattenGtsIdArray(this.innerResult.data as any[], 0).res;
    // For each GTS
    gtsList.forEach((gts, i) => {
      // if the GTS is a list of values
      if (GTSLib.isGtsToPlot(gts)) {
        const data = [];
        // Compute the GTS color
        const c = ColorLib.getColor(gts.id || i, this.innerOptions.scheme);
        const color = ((this.innerResult.params || [])[i] || { datasetColor: c }).datasetColor || c;
        // For each value
        gts.v.forEach(d => {
          // Handle date depending on the timeMode and the timeZone
          const date = GTSLib.utcToZonedTime(d[0], this.divider, this.innerOptions.timeZone);
          const dateLabel = (this.innerOptions.timeMode || 'date') === 'date'
            ? GTSLib.toISOString(GTSLib.zonedTimeToUtc(date, 1, this.innerOptions.timeZone), 1, this.innerOptions.timeZone, this.innerOptions.timeFormat)
              .replace('T', '\n').replace(/\+[0-9]{2}:[0-9]{2}$/gi, '')
            : date;
          // add the label
          if (!labels.includes(dateLabel)) {
            labels.push(dateLabel);
          }
          // add the value
          data.push(d[d.length - 1]);
        });
        // add the dataset
        datasets.push({
          label: ((this.innerResult.params || [])[i] || { key: undefined }).key || GTSLib.serializeGtsMetadata(gts),
          data,
          borderColor: color,
          backgroundColor: ColorLib.transparentize(color, 0.5)
        })
      }
    });
    if (!!this.chartElement) {
      const ctx = this.chartElement.getContext('2d');
      if (!this.myChart) {
        this.myChart = new Chart(ctx, {
          type: 'radar',
          data: { labels, datasets },
          options: {
            animation: false,
            responsive: true,
            maintainAspectRatio: false
          }
        });
      } else {
        this.myChart.data = { labels, datasets };
        this.myChart.update();
      }
    }
  }
That is all.
Test and run
At first edit src/index.html:
<!DOCTYPE html>
<html dir="ltr" lang="en">
  <head>
    <meta charset="utf-8" />
    <meta name="viewport" content="width=device-width, initial-scale=1.0, minimum-scale=1.0, maximum-scale=5.0" />
    <title>Stencil Component Starter</title>

<!-- Import Discovery -->
    <script nomodule src="https://unpkg.com/@senx/discovery-widgets/dist/discovery/discovery.js"></script>
    <script type="module" src="https://unpkg.com/@senx/discovery-widgets/dist/discovery/discovery.esm.js"></script>

<!-- Import your plugin -->
    <script type="module" src="./build/discovery-plugin-radar.esm.js"></script>
    <script nomodule src="./build/discovery-plugin-radar.js"></script>

 </head>
  <body>
<!-- Define a one tile dashboard with "radar" as a chart type and random values -->
    <discovery-dashboard url="https://sandbox.senx.io/api/v0/exec" dashboard-title="Test" debug>
      {
        'title' 'Test'
        'description' 'Dashboard test'
        'tiles' [
          {
            'title' 'test'
            'x' 0 'y' 0 'w' 12 'h' 2
            'type' 'radar'
            'macro' <%
              NOW 'now' STORE
              1 4 <%
                  DROP NEWGTS 'g' STORE
                  1 10 <%
                      'ts' STORE $g $ts STU * $now + NaN NaN NaN RAND ADDVALUE DROP
                  %> FOR
                  $g
              %> FOR
            %>
          }
        ]
      }
      </discovery-dashboard>
  </body>
</html>
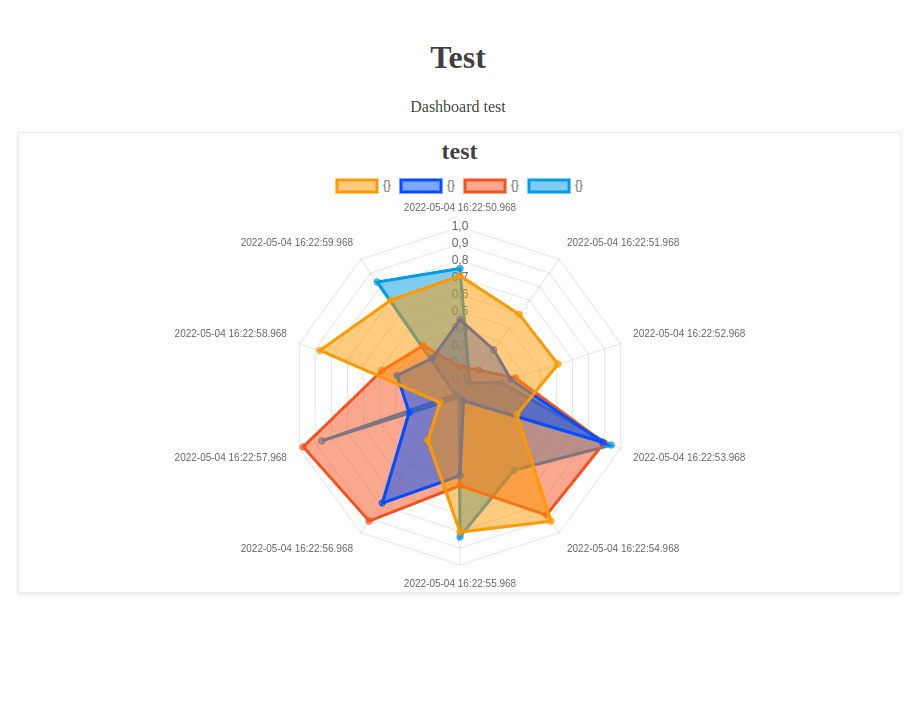
And now, start your dev server:
$ npm run startHere you are:
Going further
Now, you can develop your own tiles and charts. Feel free to publish them on NPMjs.org.
Let us know about your creations.
A final thought
But how to use the plugin mechanism with Discovery Explorer? It handles plugins since 1.0.12.
Create a conf file, like conf.json:
{
  "dashRoot": "/data",
  "plugins": [
    {
      "name": "radar-module",
      "src": "https://unpkg.com/discovery-plugin-radar/dist/discovery-plugin-radar/discovery-plugin-radar.esm.js",
      "isModule": true
    },
    {
      "name": "radar-nomodule",
      "src": "https://unpkg.com/discovery-plugin-radar/dist/discovery-plugin-radar/discovery-plugin-radar.js",
      "isModule": false
    }
  ]
}
The "dashRoot" field must remain like that.
The conf file defines a list of plugins to include, the module version and the nomodule version like we saw in the previous index.html file.
And now start the docker image:
$ docker run --rm -d -p9090:3000 \
   -v /path/to/your/conf.json:/opt/discovery-dashboard/conf.json \
   -v /path/to/your/dashboards:/data discovery-test:latest
Discover more articles and tutorials about Discovery.
Read more
Health data analysis made easy with Warp 10
Discovery Explorer - The dashboards server
Demystifying LevelDB

Senior Software Engineer