With its unique dashboards as code approach, Warp 10 Discovery is the tool of choice to create highly dynamic dashboards from your time series data
When you hear people talk about time series, chances are pretty high they will also coin the term dashboard in the same conversation. The reason for that is simple. Among the first things people do when working with time series databases is the creation of dashboards to visualize the stored data.
Despite some efforts to create alternative tools or services, Grafana remains the number one choice for many to create dashboards. Sure Grafana is great. It can connect to many data sources, has some nice themes and widgets. And it has a visual interface for building dashboards that appeals to newcomers.
But once you get into some serious monitoring and want to build complex dashboards, the visual interface you used to love quickly becomes the one you start hating. Indeed, it is long and tedious to create large dashboards this way and impossible to create what we call dynamic dashboards.
What are dynamic dashboards?
For some, dynamic dashboards are the ones that periodically update with recent data. For others, they are dashboards which can display information about a variable number of systems based on parameters that are chosen dynamically by the viewer. Though there is indeed a dynamic nature to those dashboards it is really light.
What we call dynamic dashboards are dashboards whose content can completely change depending on the actual context. Instead of always showing the same graphs, dynamic dashboards will display contextual information that will immediately catch your attention.
Imagine for example a dashboard showing the current trend for a system. It will display the last hour of data and will rely on you to spot the anomalies. A dynamic dashboard on the other hand would also display the last hour as the standard dashboard. But upon detecting a specific situation it would additionally display graphs for other systems, the list of alerts which were triggered, links to knowledge base articles related to the nature of the current incident, and a status of possibly impacted systems, all on the same screen.
Building such dashboards using a tool like Grafana is impossible. You would probably need to build a full-fledged application that may redirect to different Grafana dashboard URLs depending on the context. Not the most efficient way to go…
Introducing Discovery
At SenX we strongly believed that there was a better way, and we proved it with the creation of Discovery.
Discovery is SenX's dashboarding solution for the Warp 10 Time Series Platform. What makes Discovery unique is its Dashboards as Code approach.
With Discovery, creating dashboards is simply a matter of using a specific macro in your WarpScript or FLoWS code.
The macro expects a list of tile descriptions and an optional set of global parameters. It will produce an HTML rendering of your dashboard, complete with auto-refresh capabilities.
Coupled with the HTTP Plugin, you can serve those dashboards directly from your Warp 10 instance, avoiding the need to deploy and operate additional tools such as Grafana and therefore keeping your cloud bill under more control.
And since your dashboards are now pieces of code, you can use git to manage them and track changes. No more bad surprises after a colleague changed the style or the layout of important dashboards because s/he thought the change was only local… I'm sure you have experienced this before!
Discovery in practice
Putting Discovery to work is very simple. You should have your first dashboard available minutes after you start.
| The full documentation of Discovery is available on discovery.warp10.io |
Configuring the HTTP Plugin
The first step to use Discovery is to configure the HTTP Plugin in your Warp 10 instance. To do this, add the following lines to a configuration file and restarting the instance:
# Load the HTTP Plugin
warp10.plugin.http = io.warp10.plugins.http.HTTPWarp10Plugin
# Define the directory where endpoint spec files will reside
http.dir = /path/to/http.dir
# Define the host and port the plugin should bind to
http.host = 127.0.0.1
http.port = 12345
# Expose the Directory and Store, so FETCH requests can be performed via the plugin
egress.clients.expose = true
The next step is to create a discovery.mc2 endpoint specification file for the HTTP Plugin. Create this file in the http.dir directory defined above with the following content:
{
  'path' '/discovery/'
  'prefix' true
  'parsePayload' true
  'macro' <%
    'prefix/dashboard/' @senx/discovery/dispatcher
  %>
}
This specification defines the handling of requests to the HTTP Plugin for URLs starting with /discovery/. Requests for /discovery/foo/bar will invoke the macro @prefix/dashboard/foo/bar. The macro will be called with the request object from the HTTP Plugin and is expected to return the HTML content of your dashboard, more on this later.
The dispatching of requests is ensured by the macro @senx/discovery/dispatcher. This macro is available on SenX's WarpFleet macro repository which is configured by default in the Warp 10 distribution via the line:
warpfleet.macros.repos = https://warpfleet.senx.io/macrosIf you would rather host the macro locally, you can download it and save it under senx/discovery/dispatcher.mc2 in your instance local macro repository.
Creating dashboards
The second and final step is to create macros for each of your dashboards. If you have configured the plugin as above, those macros should be in the subdirectory prefix/dashboard of the macro repository of your Warp 10 instance.
Dashboard macros are pretty simple. They define tiles which compose your dashboard and call a macro that renders those tiles as HTML. This macro and a set of side macros are also available on SenX's WarpFleet macro repository. In case you want to deploy them locally, download the following files:
And deploy them in subdirectory senx/discovery of your Warp 10 instance macro repository (configured via warpscript.repository.directory).
The @senx/discovery/render macro expects a map as input with the following entries:
 {
     'title' 'My Dashboard'
     'description' 'My tremendous dashboard'
     'tiles' [ ... ]
     // Custom CSS styles
     'styles' '<style> body { background: pink; }</style>'
     // Custom HTML Header
     'header' "<div><img src='myLogo.png'></div>"
     // Custom HTML Footer
     'footer' '<p>Copyright SenX.io</p>'
     'cols'   12
     // Number of columns of the grid, default is 12
     'height' 220
    // Row height in pixels, 220 by default
     'template' '...'
   // Custom HTML template
 }
The only mandatory element is tiles which must be associated with a list of tile descriptions. Each tile description if a map with the following elements:
{
 'title' 'Title of the tile' // optional
 'x' 0 // Horizontal position in the grid, between 0 and grid width - optional, defaults to 0.
 'y' 0 // Vertical position in the grid - optional, defaults to 0.
 'w' 1 // Width of the tile in number of grid columns - optional, defaults to 1.
 'h' 1 // Height of the tile in number of grid rows - optional, defaults to 1.
 'options' {} // WarpView specific options - optional (!).
 'type' 'plot' // Type of WarpView tile - optional, defaults to `plot`.
 'endpoint' 'https://sandbox.senx.io/api/v0/exec' // Warp 10 `/api/v0/exec` url - mandatory when 'macro' is set.
 'macro' <% ... %> // WarpScript macro to run to produce data for the tile - use only if 'data' is not set.
 'data' ... // Data to represent in the tile resulting from a WarpScript execution - use only if 'macro' is not set. The content type depends on the type of the tile.
}
The types of tiles you can use are those from the WarpView web component library.
That's it! You should now be able to create your dashboards, but to make things even clearer we will walk you through an example.
Demo dashboard
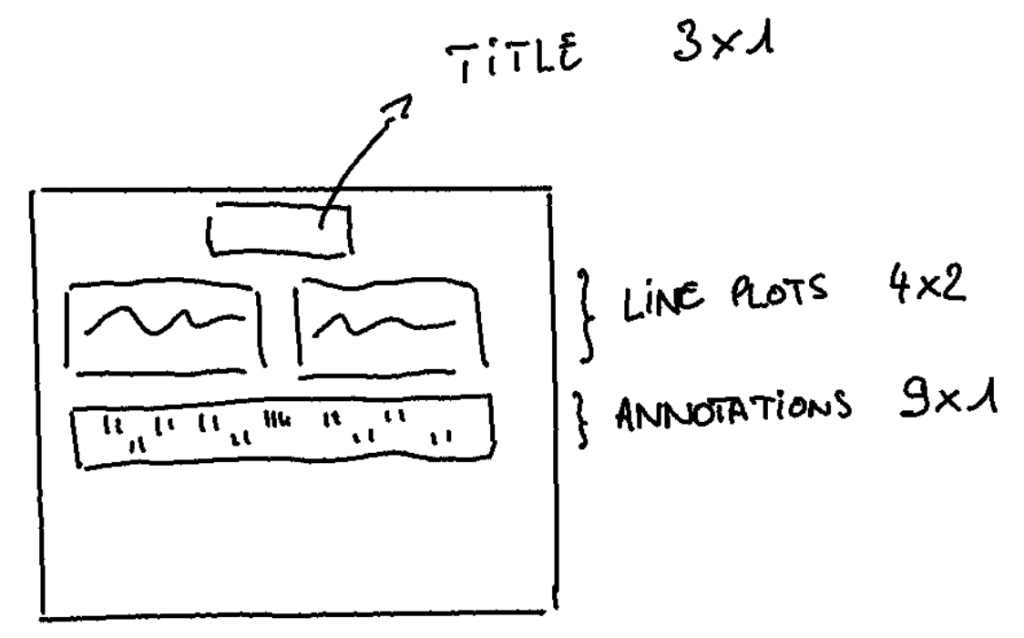
The first step is to plan the layout of your dashboard, you can sketch it out quickly on a piece of paper:
Then create the macro which will define the tiles and call @senx/discovery/render to generate the HTML. In our example, the first line plot will get its data via the data field, the second one via a macro executed on the Warp 10 Sandbox.
The resulting WarpScript code for our dashboard is:
<%
{
'tiles' [
{
'type' 'display'
'w' 3 'h' 1 'x' 3 'y' 0
'data' 'Hello Discovery'
}
{
'type' 'line'
'w' 4 'h' 2 'x' 0 'y' 1
'data' [
NEWGTS 'data' RENAME
0.0 'v' STORE
1 500
<% 1 s * NOW SWAP - NaN NaN NaN $v RAND 0.5 - + DUP 'v' STORE ADDVALUE %>
FOR
]
}
{
'type' 'line'
'w' 4 'h' 2 'x' 5 'y' 1
'endpoint' 'https://sandbox.senx.io/api/v0/exec'
'macro' <%
NEWGTS 'macro' RENAME
0.0 'v' STORE
1 500
<% 1 s * NOW SWAP - NaN NaN NaN $v RAND 0.5 - + DUP 'v' STORE ADDVALUE %>
FOR
%>
}
{
'type' 'annotation'
'w' 9 'h' 1 'x' 0 'y' 3
'data' [
NEWGTS 'annot1' RENAME 1 500 <% RAND 0.09 < <% NaN NaN NaN T ADDVALUE %> <% DROP %> IFTE %> FOR
NEWGTS 'annot2' RENAME 1 500 <% RAND 0.09 < <% NaN NaN NaN T ADDVALUE %> <% DROP %> IFTE %> FOR
NEWGTS 'annot3' RENAME 1 500 <% RAND 0.09 < <% NaN NaN NaN T ADDVALUE %> <% DROP %> IFTE %> FOR
]
}
]
}
@senx/discovery2/render
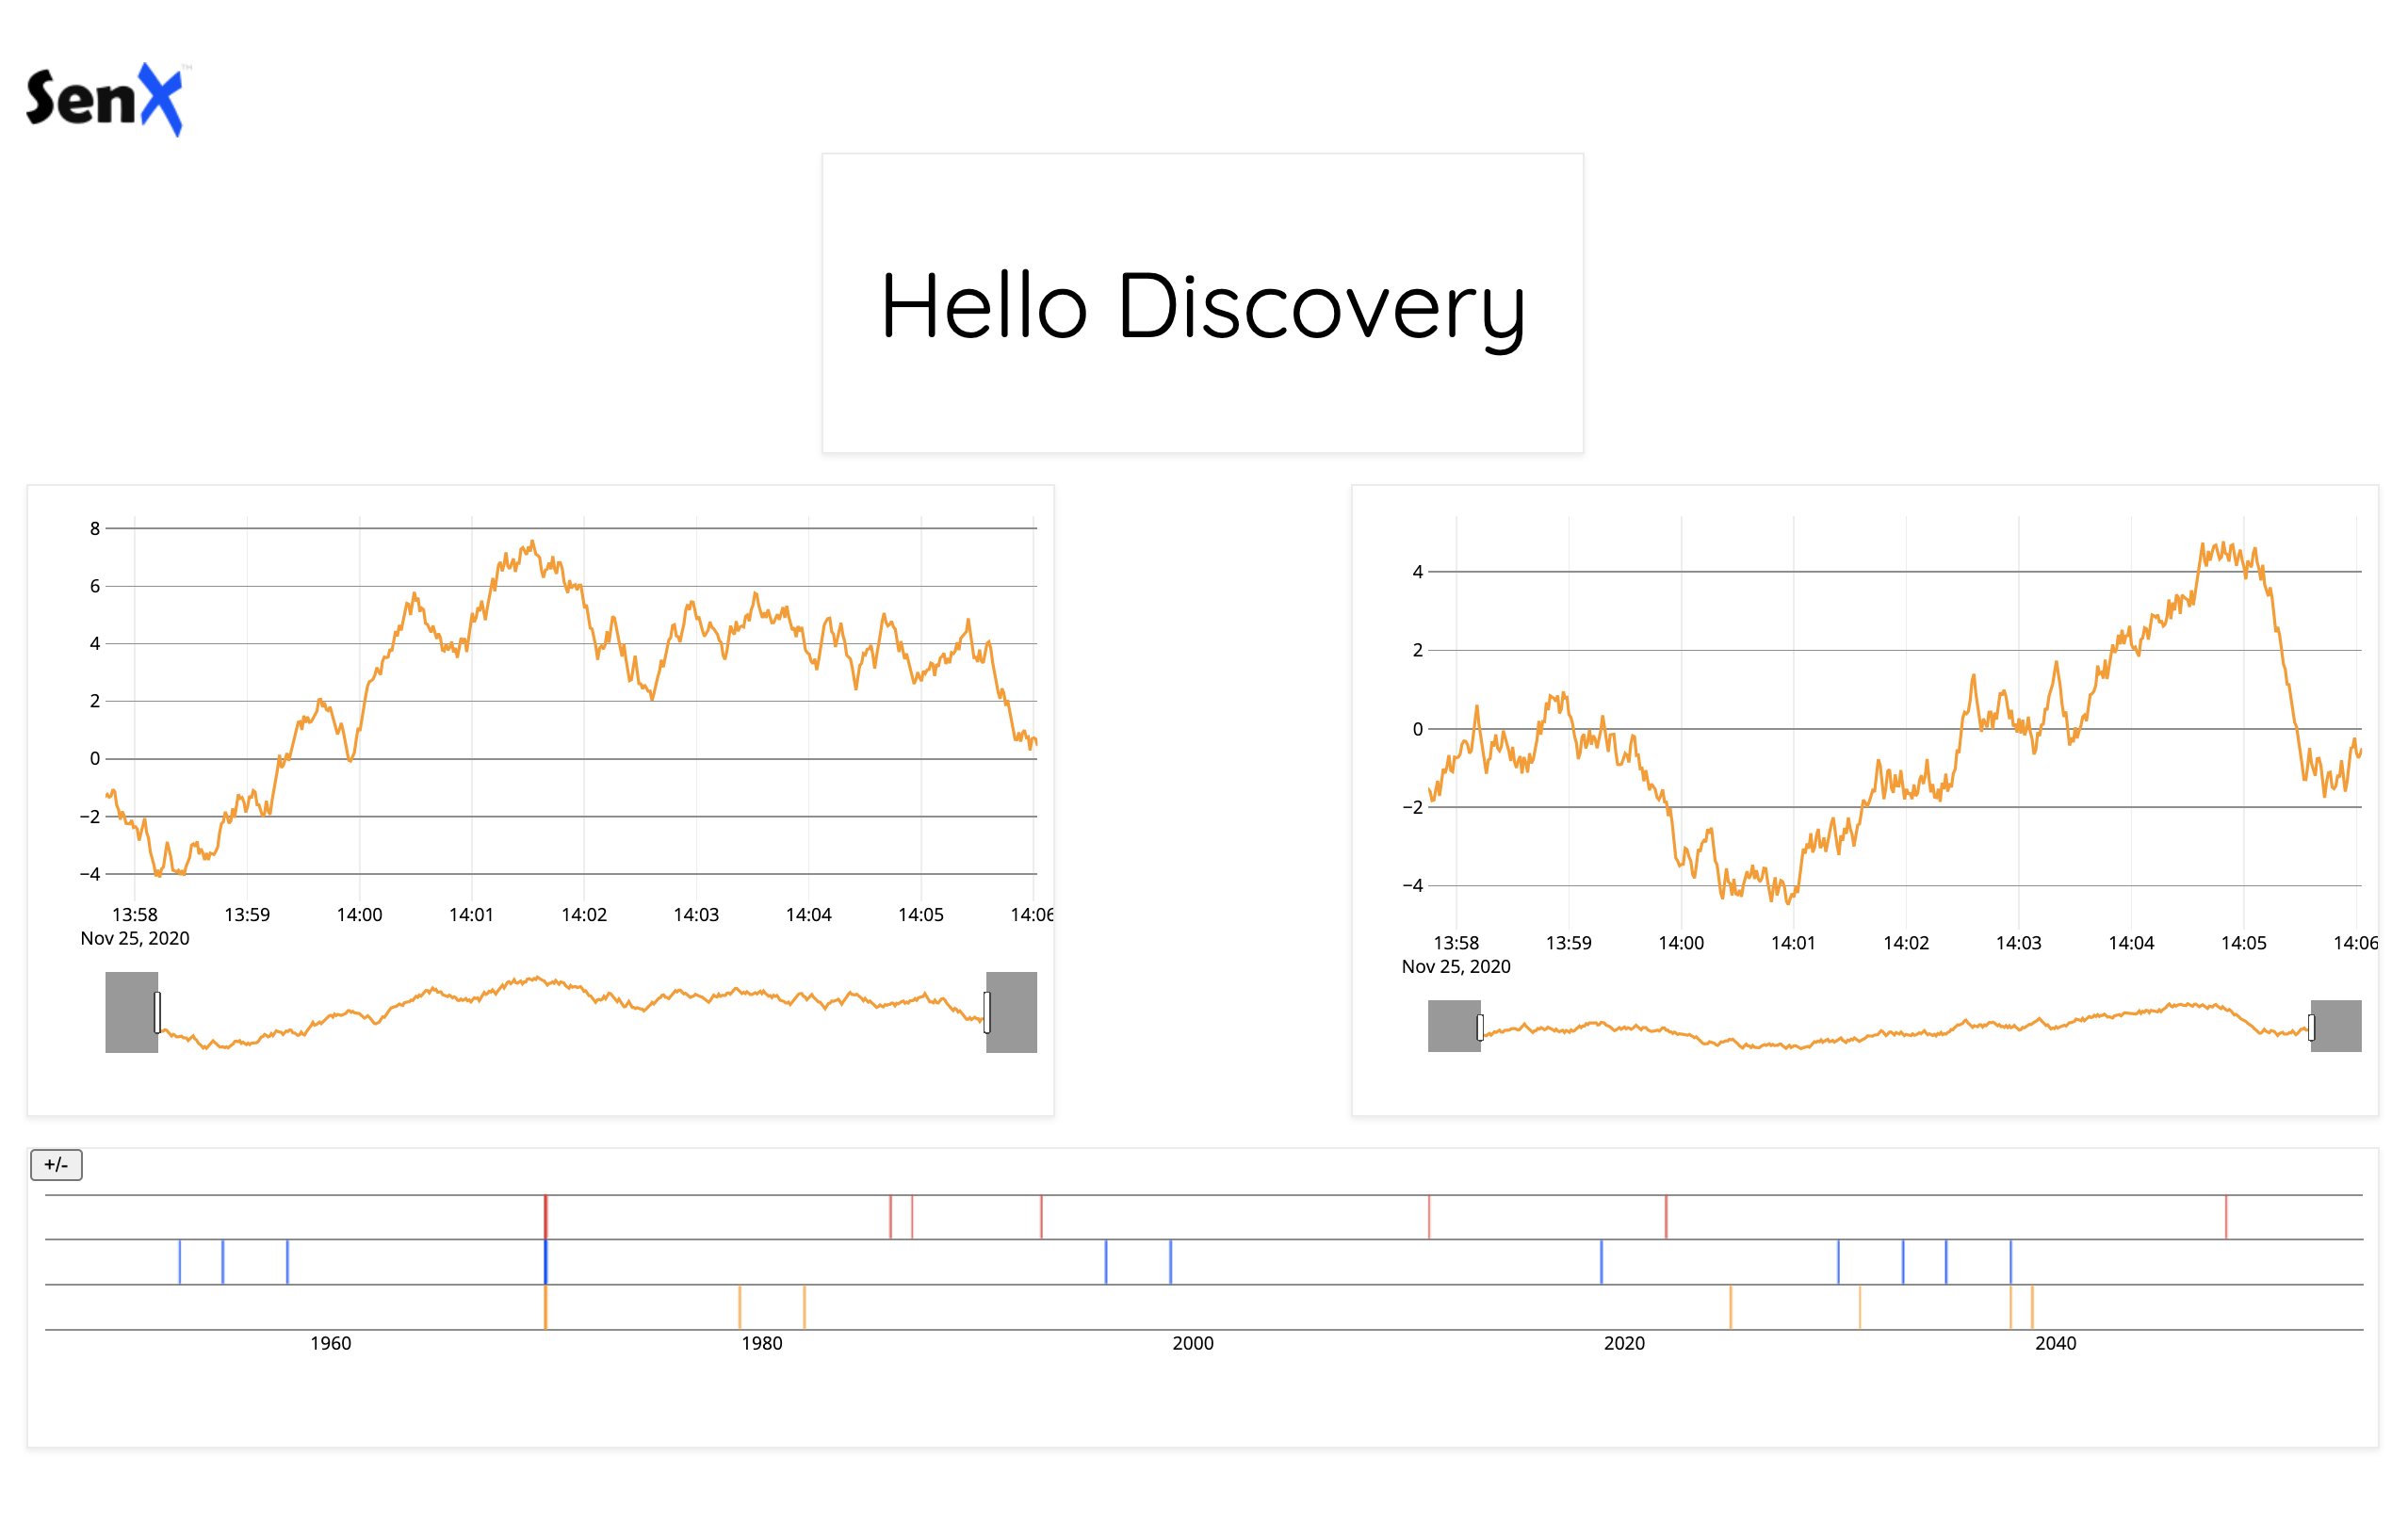
%> Most of the lines of code are for generating dummy data, not for the dashboard layout itself. Place this WarpScript code in a file prefix/dashboard/demo.mc2 in the directory configured via warpscript.repository.directory. The final URL of your dashboard will be http://127.0.0.1:12345/discovery/demo if you configured the HTTP plugin like above.
This demo dashboard has been deployed on the Warp 10 Sandbox, the HTML rendering looks like this:
Advanced topics
Once you start building dashboards with Discovery you will be hooked, so we made sure you can expand your universe past the simple dashboard we presented above.
HTML customization
The map fed to @senx/discovery2/render supports specifying various elements to customize the look and feed of your dashboards.
The html.head element can be set to HTML code which will be inserted where {{{GRID}}} occurs in the HTML template. In the default template, this is at the end of the head section of the resulting HTML document. You can use it to add extra CSS styles or meta elements, for example, to automatically refresh the page if your tiles only use the data element in their definitions.
The header element will insert HTML code where {{{HEADER}}} is in the template. In the default template, this is just before the layout grid.
The footer element will insert HTML code where {{{FOOTER}}} is in the template, just after the layout grid in the default template.
Custom templates
You can provide your own HTML template by setting the template field to a STRING containing your custom template. The template should contain the following placeholders:
{{{CSS}}} which will be replaced by all the required CSS definitions for WarpView tiles, ideally in the head section of your HTML document.
{{{GRID}}} which will be replaced with the actual dashboard content, ideally this is inside a div.
{{{JS}}} which will be replaced with some JavaScript code, this should appear at the end of the body section.
Visual editor
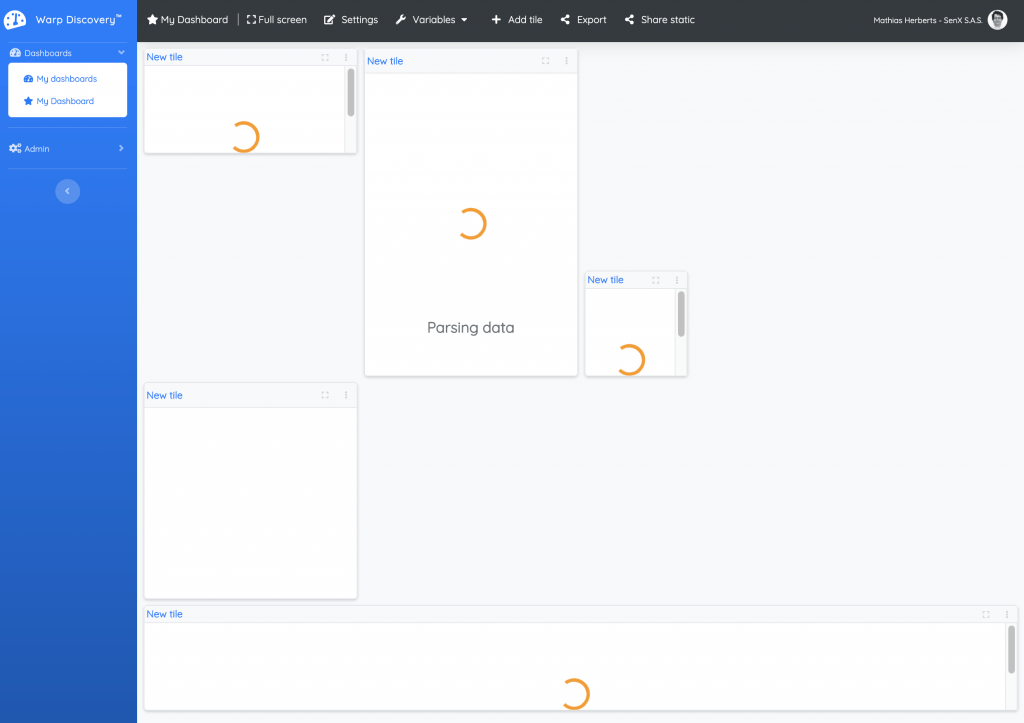
We are working on a visual editor for visually creating your dashboards. The tool has the ability to export the WarpScript code needed to render the dashboard you designed, so it inserts itself smoothly in the process between the sketch and the actual dashboard as code.
It proves very handy when your layout has many tiles of different sizes, and you don't want to compute the coordinates by hand.
This is still a work in progress, so we will keep you updated as the tool unrolls. In the meantime here is a screenshot of the current version.
WarpStudio / VSCode integration
We are also working on adding the possibility to visualize your dynamic dashboards directly within WarpStudio and via the VSCode plugin, just like images can be viewed. Stay tuned!
Takeaways
We have walked you through Discovery, our innovative approach to bring you dashboards as code as part of the Warp 10 Platform. No need to install an extraneous tool such as Grafana. And with the ability of Warp 10 to fetch data from alternate data sources, you can build all your dashboards in a single location even if Warp 10 is not yet your time series database of choice.
Here is a series of articles about Warp 10 Discovery:
- Server monitoring with Warp 10 and Telegraf
- Santa asset tracking and delivery service
- Covid Tracker built with Warp 10 and Discovery
- Using Warp 10 as a map tile server for Discovery
Come join the Warp 10 Lounge and share what you built with Discovery.
Follow us on Twitter and stay informed about our next news.
Read more
Discovery Tips&Tricks #3 - Build a form
2021 recap: new functions and tools in the Warp 10 Platform
Warp 10 Office Hours Recap - Q&A about Discovery

Co-Founder & Chief Technology Officer