Analyze your electrical consumption with your Linky data and Warp 10.
Analyze your electrical consumption provided by Linky easily with Warp 10.
Introduction
In France, electricity suppliers recently adopted a smart meter called Linky (https://fr.wikipedia.org/wiki/Linky). There are 3 ways to access its data:
- Plug a Raspberry (or something similar) directly to the Linky, but you can't access historical data
- use the Enedis APIs: https://datahub-enedis.fr/
- you need to declare an app, have a public HTTPS URL (even for tests) and implement OAuth
- and then use the Enedis customer portal: https://espace-client-particuliers.enedis.fr
Prerequisites
The easiest way is to use the Enedis customer portal. At first, you need to activate your account on https://espace-client-particuliers.enedis.fr and verify you have access to your consumption data.
Sadly, you can only fetch data at a 30 minutes granularity and between two dates. You cannot have real-time data as the Linky data are gathered each night.
Then, you need a Warp 10 instance and access tokens. For this step, you can rely on our Sandbox: https://sandbox.senx.io/
How to access and analyze your electrical consumption with your Linky data and Warp 10 Share on XSetup
To retrieve your historical data, you can use the code at https://github.com/Giwi/warp10-web-linky
git clone https://github.com/Giwi/warp10-web-linky.git
cd warp10-web-linky
npm install
cp src/conf-template.json src/conf.json
Edit src/conf.json in order to set some informations:
{
  "enedis": {
    "pdl": "Your PDL Num", // you can find this number on the Enedis portal in your contract informations
    "login": "Enedis login", // your Enedis customer portal login
    "password": "Enedis Password" // your Enedis customer portal password
  },
  "warp10": {
    "w10URL": "https://warp.senx.io/api/v0", // your Warp 10 endpoint, it could be https://sandbox.senx.io/api/v0 if you use the sandbox
    "rt": "Read token", // Warp 10's read token
    "wt": "Write token" // Warp 10's write token
  }
}
Then, create src/test.js:
const Linky = require("./lib/linky");
const conf = require("./conf");
Linky.config({
  warp10: {
    w10URL: conf.warp10.w10URL,
    rt: conf.warp10.rt,
    wt: conf.warp10.wt,
  },
  enedis: {
    login: conf.enedis.login,
    passwd: conf.enedis.password,
    pdl: conf.enedis.pdl
  },
}).updateHistory("2016-05-01", 30).then(r => { // 30 days gather step
  console.log(r)
});
You should see the number of data points uploaded to Warp 10.
Analysis
Now verify on Warp 10 (http://studio.senx.io/) by fetching data for the last 30 days with a simple WarpScript:
[ 'YOUR READ TOKEN' 'enedis.linky' {} NOW 30 d ] FETCH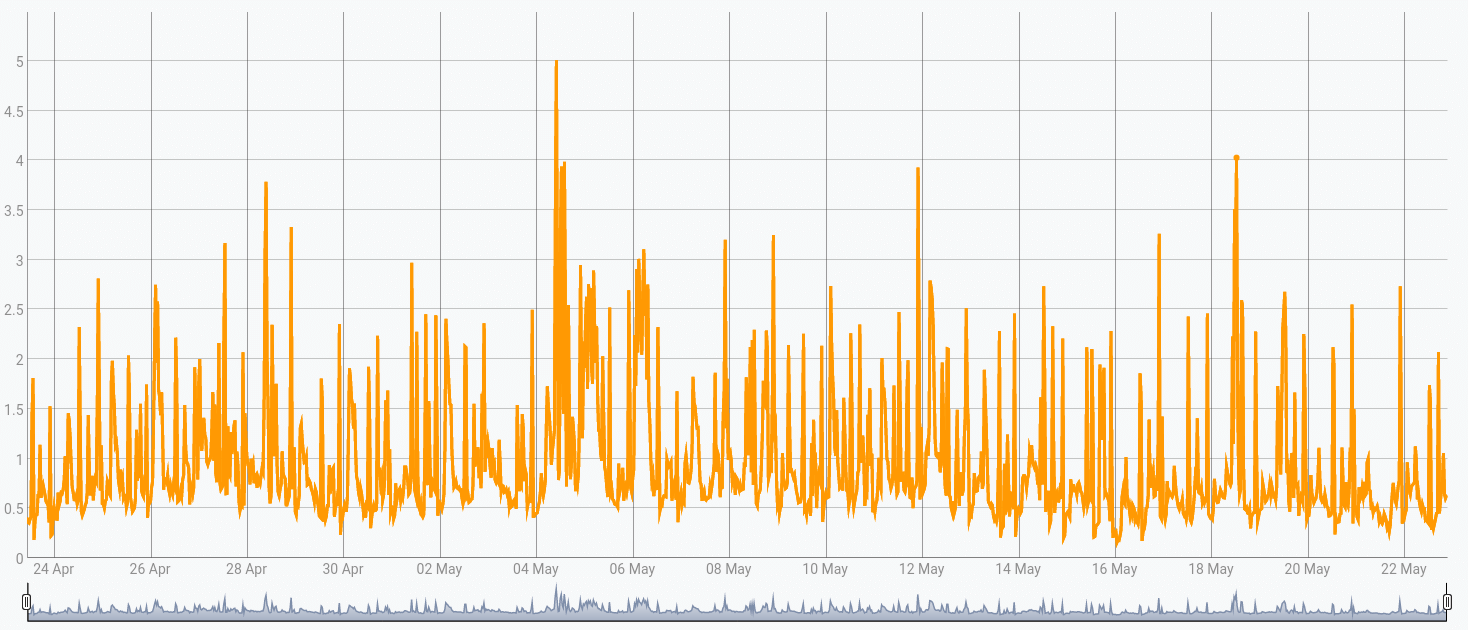
As you can see, you have details, but if you want to improve the visibility, you have 2 choices:
LTTB
The LTTB function downsamples a Geo Time Series or list thereof using the LTTB (Largest Triangle Three Buckets) algorithm. This algorithm downsamples a GTS by selecting the data points from the original GTS which will preserve the overall shape of the graphical representation of the data.
[ 'YOUR READ TOKEN' 'enedis.linky' {} NOW 30 d ] FETCH 200 LTTB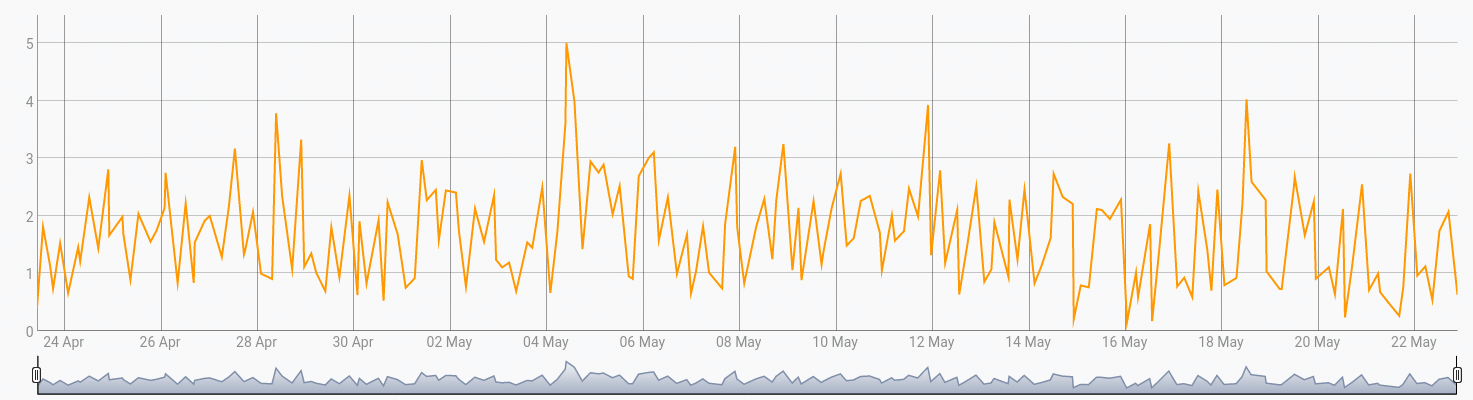
BUCKETIZE
You can also bucketize (more info) your series to resample it at your desired rate:
[ 'YOUR READ TOKEN' 'enedis.linky' {} NOW 30 d ] FETCH
'gts' STORE
[ $gts bucketizer.mean NOW 6 h 0 ] BUCKETIZE // 6 hours mean compute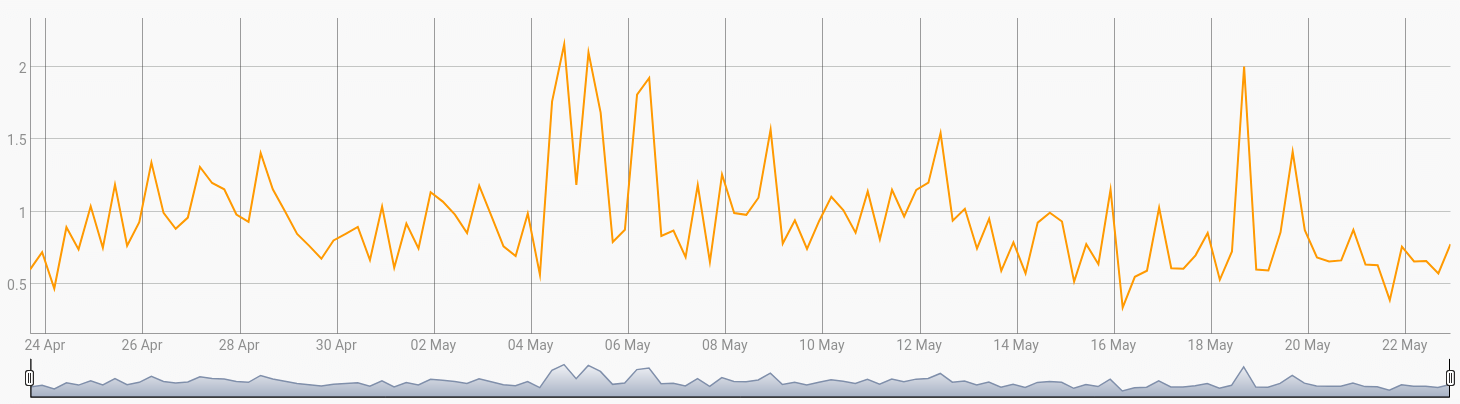
Add your subscribed power
As you have seen, we added your subscribed power limit to a label called "subscribed". Now, display it on the chart:
[ 'YOUR READ TOKEN' 'enedis.linky' {} NOW 30 d ] FETCH
'gts' STORE
[ $gts bucketizer.mean NOW 6 h 0 ] BUCKETIZE
0 GET 'gts' STORE

// get and store the subscribed power
$gts LABELS 'subscribed' GET TODOUBLE 'subscribed' STORE

// get the first tick of the series
$gts FIRSTTICK 'first' STORE // get the last tick
$gts LASTTICK 'last' STORE   // create a new series

// create a new GTS and add the two values
NEWGTS 'subscribed' RENAME // add the two values
$first NaN NaN NaN $subscribed ADDVALUE
$last NaN NaN NaN $subscribed ADDVALUE

$gts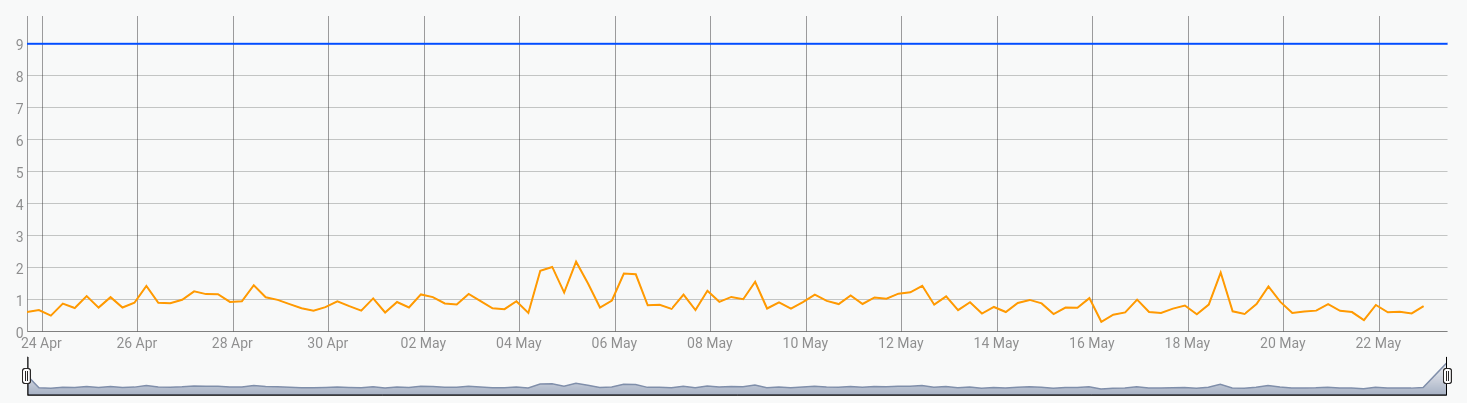

Consumption evolution
And now, we will accumulate the consumption over time:
Using INTEGRATE:
[ 'YOUR READ TOKEN' 'enedis.linky' {} NOW 30 d ] FETCH
0 INTEGRATE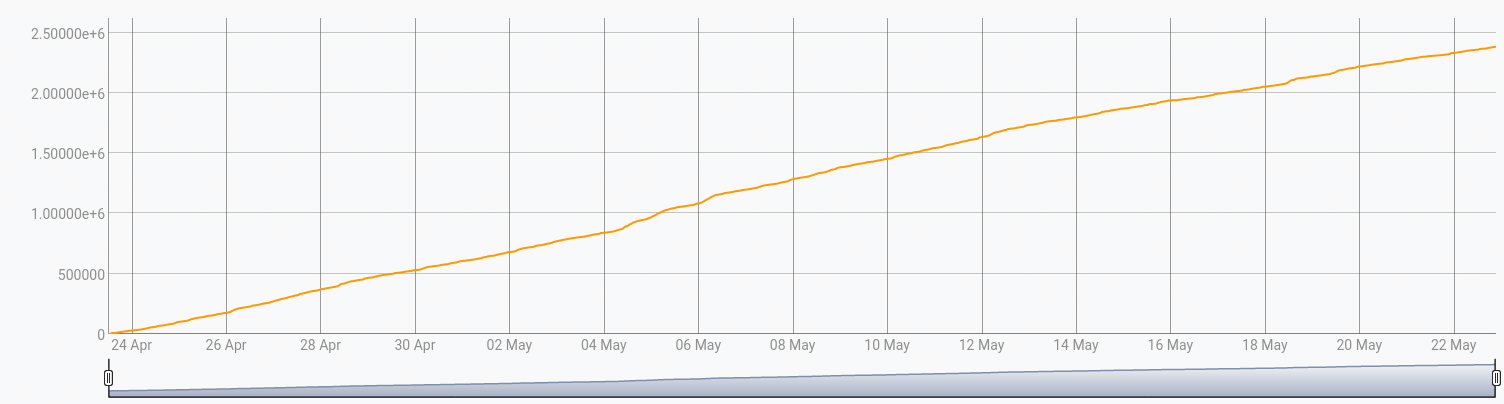
Load duration curve
A load duration curve illustrates the variation of a certain load in a downward form such that the greatest load is plotted on the left and the smallest one on the right. On the time axis, the time duration for which each certain load continues during the day is given. (learn more)
[ 'YOUR READ TOKEN' 'enedis.linky' {} NOW 30 d ] FETCH
'gts' STORE

[ $gts bucketizer.mean 0 1 h 0 ] BUCKETIZE
0 GET 'gts' STORE

$gts NAME 'name' STORE // get the className of the GTS
$gts LABELS 'labels' STORE 	// get labels

// reverse the order of values
$gts RVALUESORT VALUES 'values' STORE

// init increment
0 'i' STORE // create a new gts to change the original tick by an increment
NEWGTS $name RENAME // rename the GTS
$labels RELABEL // put labels
'data' STORE
$values <%
'val' STORE
  // add the value in the new GTS
  $data $i NaN NaN NaN $val ADDVALUE DROP
  $i 1 + 'i' STORE // increment
%> FOREACH
$data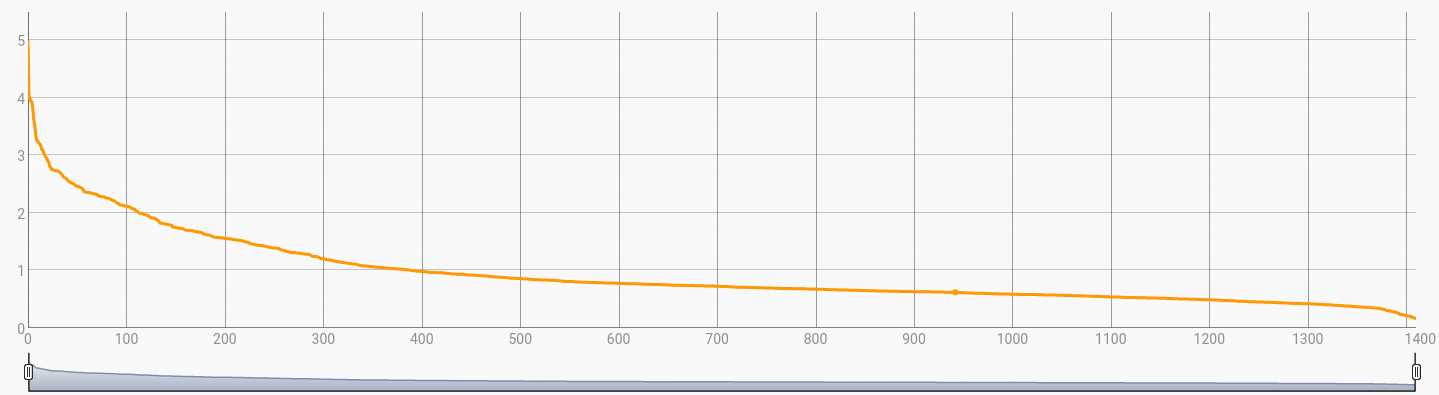
Detect outliers
Here is the final part: detecting outliers in my power consumption. We will use ESDTEST (extreme studentized deviate test).
[ 'YOUR READ TOKEN' 'enedis.linky' {} NOW 30 d ] FETCH
0 GET 'gts' STORE

// get the className of the GTS and suffix it
$gts NAME '.outlier' + 'name' STORE
// get labels
$gts LABELS 'labels' STORE

// create a new GTS
NEWGTS $name RENAME // rename the GTS
$labels RELABEL // put labels
'outliers' STORE

// Detect 5 anomalies per GTS using an ESD (Extreme Studentized Deviate) Test
$gts 5 false ESDTEST 'timestamps' STORE

// Convert the ticks identified by ESDTEST into an annotation GTS
$timestamps <%
  'timestamp' STORE
  $outliers $timestamp NaN NaN NaN 'outlier' ADDVALUE
  DROP
%> FOREACH // for each timestamp

// display both GTS
$outliers // outliers
$gts // original
Conclusion
This is a short example of how to analyze your electrical consumption data. I'm sure, there is a lot of additional analysis to do with it. WarpScript offers tons of powerful capabilities, which help you to go further in the analysis, like pattern detection, time period comparison, outlier detection, and so on.
I chose the easy way to collect data, but with a bit of DIY, you will be able to gather data in real-time directly plugged onto the meter. The historical data can be fetched through the customer portal.
Let us know on Twitter what kind of analysis you have done with your own data.
Read more
FETCHez la data !
WarpStudio v2: What's new in our Web IDE?
LevelDB extension for blazing-fast deletion

Senior Software Engineer