WarpScript, the data programming language of the Warp 10 platform, offers built-in functions to help you detecting anomalies. We review them in this post.

In this blog post, we are going to review some WarpScript built-in functions that can be used for detecting anomalies in time series.
A quick glance at the WarpScript documentation brings us the following functions:
Why are there so many built-in functions for this task?
The reason is simple: an anomaly may not be defined in the same way from one use case to another. So we need multiple functions to answer different scenarios.
| How to easily manipulate raw binary payloads in WarpScript |
Threshold based detection
In a lot of cases, we can detect an anomaly with a simple threshold technique. That is, if a value is too high (or too low), it is considered an anomaly.
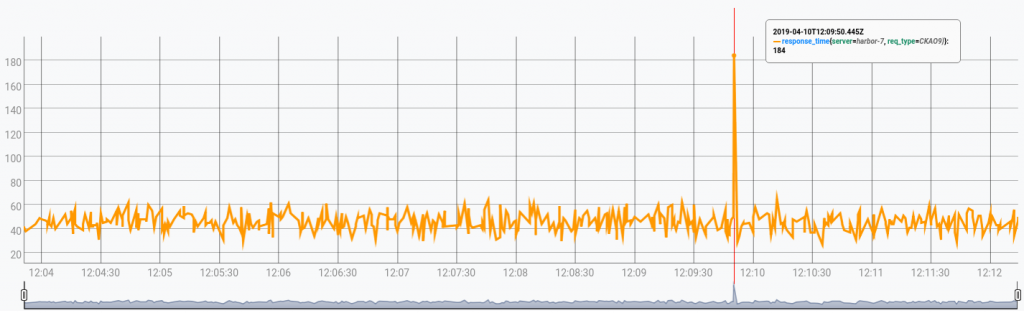
Let's begin with a simple example. The time series that is depicted below contains the response times of a certain type of request:
Note that if you want to reproduce the results, you can pick the data here, and push it with just a few clicks into a free Warp 10 Sandbox.
In this case, we can use THRESHOLDTEST to detect values that are too high:
// Fetching data
[ '<insert-your-token-here>' 'response_time' {} NOW -500 ] FETCH
'gts' STORE

// Detect anomalies
$gts 100.0 THRESHOLDTEST

// Convert each anomaly to readable date format
0 GET <% 'CET' ISO8601 %> FOREACH
[TOP]: "2019-04-10T14:09:50.445855+02:00"Here, the anomaly detection is done by this piece of code 100.0 THRESHOLDTEST, which detects every point of the time series which values are above 100.
If we want instead to detect points below a certain value, this is also possible. All we need is to multiply each value by -1 prior to applying THRESHOLDTEST.
For example, the following macro does this:
<%
  [ 'gts' 'threshold' ] STORE
  $gts -1.0 * $threshold -1.0 * THRESHOLDTEST
%>
'lower_THRESHOLDTEST' STORE
Indeed, it is also possible to make a two-way threshold test, using mapper.abs.
With these types of techniques, all you need is a threshold value that is usually found empirically.
Another option
Another approach is to set a threshold that depends on how many anomalies differ from the mean (or median) of the series. This is what the ZSCORETEST function does.
For instance,
$gts false 3.0 ZSCORETESTdetects anomalies that are at least 3 standard deviations away from the mean.$gts true 3.0 ZSCORETESTdetects anomalies that are at least 3 median absolute deviations away from the median.
With ZSCORETEST inside a MACROMAPPER, it is also possible to build a moving threshold that depends on a moving mean and standard deviation (or moving median and median absolute deviation). The macro moving_ZSCORETEST.mc2 does this.
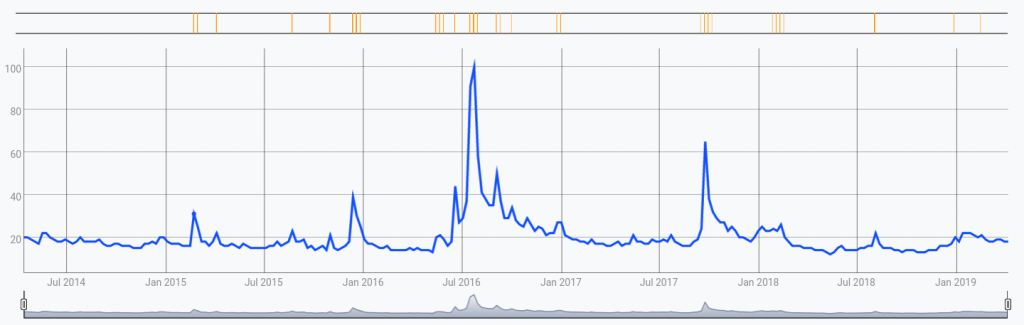
As an example, let's apply this macro on data obtained from the trend of the keyword "Star Trek" in google searches. You can retrieve the same data we used on this link:
You can reproduce this result with:
// Fetching data
[ '<insert-your-token-here>' 'google_trend' {} NOW -500 ] FETCH
0 GET 'gts' STORE

// Detect anomalies (orange flags)
$gts 5 5 0 1 @moving_ZSCORETEST

// Display data (blue graph)
$gts
In this image, the orange flags represent anomalous ticks. As we can see, some ticks are flagged as anomalies even though their value is lower than that of other non-anomalous ticks.
Again, there is no better method than another, which one will work best depending on your use case.
Statistical tests
Another common use case is to detect statistical outliers. That is, when your data is assumed to follow a statistical distribution, an outlier is a value that is very unlikely to occur.
To be clear, this doesn't mean that a value with a low probability of happening is necessarily an outlier. However, if it occurs too much relative to what is likely to be expected, it should be one. That is a case where statistical tests are useful.
For example, considering the value that deviates the most from the mean (or median), the Grubbs' test answers the following question: "Supposing my data follows a normal distribution, is this value an outlier?".
In WarpScript, you can make a Grubbs' test like this: $gts false GRUBBSTEST (set the second parameter to false to compare to the mean, and true to compare to the median).
If you know that your data can have at most one outlier (for example, if you have discarded all previous outliers), then the Grubbs' test can do the job.
However, if there might be more outliers, you can do what is called a generalized extreme studentized deviate (ESD) test. For this test, the WarpScript syntax is as follows: $gts k false ESDTEST, where k is an upper bound of the number of outliers to be detected.
| How does a time series correlate with its past? Read this article to learn more. |
Seasonal adjustments
Some series have strong seasonal correlations. For example, if you wake up every morning around 7 a.m., then the electricity consumption of your room will rise up significantly compared to when you were asleep. However, this is not to be considered as an outlier since it happens every day. On the other hand, if the same kind of electricity consumption happens in the middle of the night, this should be considered an outlier.
To handle seasonal use cases, WarpScript offers three built-in functions: STLESDTEST, HYBRIDTEST, and HYBRIDTEST2. Each one proceeds by removing a seasonal and a trend component prior to performing an ESD test. More specifically:
STLESDTESTperforms an STL decomposition to extract the seasonal and trend components. It is the straightforward way to implement this approach, but it also the most computationally expensive.HYBRIDTESTis a technique that was invented by folks from Twitter. It also performs an STL decomposition. However, it approximates the seasonal extraction with the seasonal mean, still apply loess smoothing in STL, and detrends the series with a local median.HYBRIDTEST2is an improvement we made over the previous one in terms of speed efficiency. It also detrends the series with the local median. However, it removes an amount of the seasonal mean factored by a seasonal notion of entropy.
Let's compare them on some test data (you can retrieve this data here). We use the following WarpScript code:
// Fetching and bucketizing data
[ '<insert-your-token-here>' 'count' {} NOW NOW ] FETCH
[ SWAP bucketizer.last 0 60 s 0 ] BUCKETIZE
0 GET 'gts' STORE

// This macro creates a boolean GTS from a list of anomalous ticks
<%
  NEWGTS
  SWAP
  <% NaN NaN NaN true ADDVALUE %> FOREACH
%> 'labelAnomalies' STORE

// Detecting anomalies
60 24 * 'seasonality' STORE
$gts $seasonality 9 300 HYBRIDTEST2 @labelAnomalies 'hybrid2' RENAME
$gts $seasonality 9 300 HYBRIDTEST @labelAnomalies 'hybrid' RENAME
$gts $seasonality 300 0.01 STLESDTEST @labelAnomalies 'stlesd' RENAME
$gts
To get an idea of their relative computational speed: on my laptop STLESDTEST took 13.64s, HYBRIDTEST took 11.11s, and HYBRIDTEST2 took 0.43s, using version 2.1 of Warp 10™. The result is depicted below:
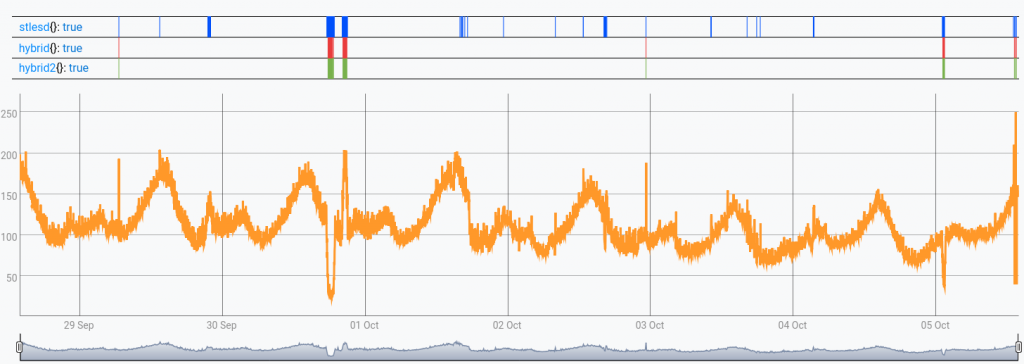
As we can see, STLESDTEST finds more anomalies than HYBRIDTEST and HYBRIDTEST2. Depending on the use case, this can be a good thing or not, since there can be a lot of false alarms in those. Since the data is borrowed from there, which actually comes from some of Twitter's production data (the same source that originated the algorithm implemented by HYBRIDTEST), we can tend to think these are mostly false alarms in this case.
It is also worth noting that HYBRIDTEST2 was able to obtain the same results as HYBRIDTEST about 20 times faster here.
Conclusion and other approaches
If you have read this far, you are now able to resolve anomaly detection tasks in WarpScript, by applying threshold-based techniques and statistical tests, with or without seasonal adjustment.
Depending on your use case, you might want to have a look at other approaches. For instance, DISCORDS and ZDISCORDS implement techniques based on symbolic representation. Another example is the function ANOMALIES from the Warp 10 forecasting extension (commercially available via SenX), which is based on forecast models (either ARIMA or LSTM neural network).
Since those functions are based on techniques that are not specific to the task of anomaly detection, we leave their explanation for another blog post.
Until then, take care!
Read more
WarpScript in Jupyter notebooks
How does a time series correlates with its past?
Our vision of Industry 4.0 and the 4 stages of maturity

Machine Learning Engineer