Follow this tutorial and learn about an operation called matrix profile that profiles a time series in order to discover patterns.
A subsequence in a time series can be a pattern with a meaningful interpretation, but most of the time that is not the case: it is just an abstract sequence of values and we are lacking some sort of information in order to make an interpretation, let alone an application. We also don't know where to look at. So we need first to discover patterns that could be relevant.
Here comes matrix profile, a formula for pattern discovery invented in 2016 by Yeh et al.
The matrix profile consist in scanning efficiently the entire time series to find which patterns would repeat (or be very similar to each other). These patterns are then called motifs. It is not unlikely then that they have a real-world interpretation (and maybe application).
In the same way, we could search for subsequences that are very different from each other sub-sequences in the time series. These sequences are called discords and could be interpreted as a detected anomaly.
| Read more: Detecting anomalies with WarpScript built-in functions |
Setup
To start off, you can install the matrix profile extension. It contains the function MP.PROFILE, which uses an efficient algorithm that computes the matrix profile, as the name of the extension suggests.
You can pull the extension using the warpfleet-cli and register the extension on your local Warp 10 instance. Alternatively, you can try it on the sandbox where is it installed for now.
Test data
In this tutorial, we will use pressure data expressed in kPa. If your WarpFleet macro resolver points to the default official SenX repository, you can load that data as:
@senx/dataset/heat_pump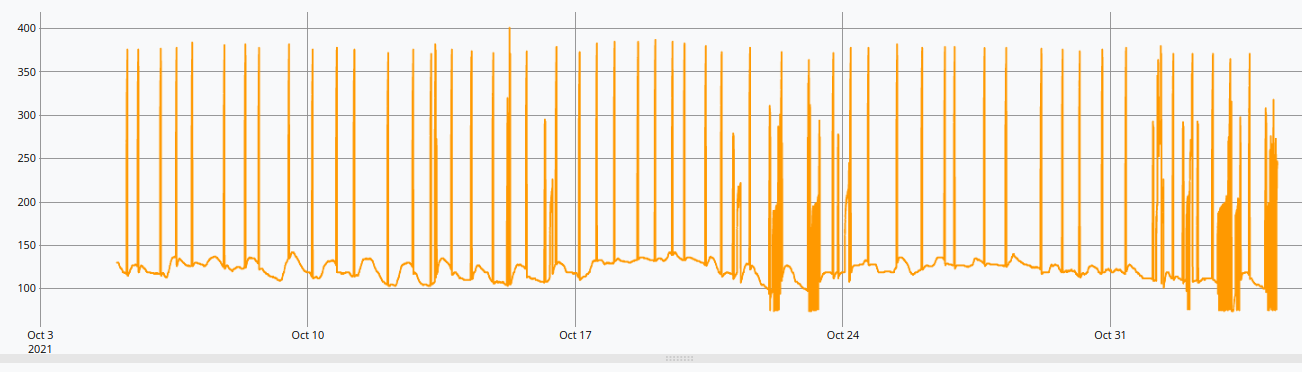
This data illustrates the pressure probed in a heat pump. As we can see, the data is largely staying between 100 and 150 kPa, but at times it goes out of this range.
In nominal conditions, the pressure stays in this range. But in practice, the heat pump has to push from time to time, thus why the spikes.
We will profile this series to search for those spike patterns. The goal is to identify when these spikes arose, if they look typical despite the fact they could be pointed out by an anomaly detection system, or if they are not.
Profiling
For the sake of simplicity, the data given here is already bucketized and filled as needed by the MP.PROFILE function. The buckets span each 3-minutes.
To apply the matrix profile, we have to choose a subsequence length parameter. This length needs not to be an exact value, but it must be large enough to cover the span of the pattern we are trying to search for.
In this case, we will use a length, in the number of buckets, for it to span a day, so 20 * 24 buckets.
20 24 * MP.PROFILE
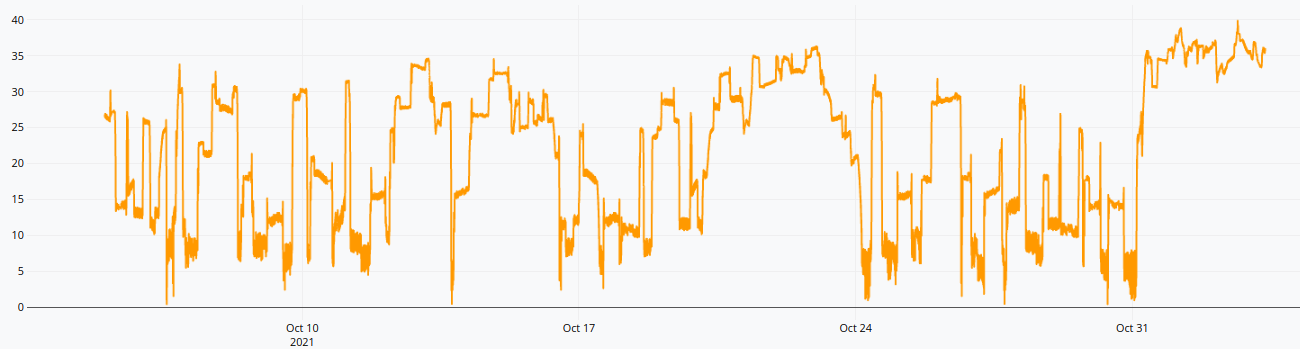
The output GTS is a profiling of the pressure time series. At each tick, it contains two pieces of information: the first is the profile value, which can be seen on this graph, and the second is a bucket index number, which is stored as the elevation component.
The value is the minimal Euclidean distance between the subsequence starting at this tick, and all other subsequences in the time series, excluding those too close. The bucket index is the associated argmin.
Good! Now that we have the matrix profile of the pressure time series, what to make of that?
Motif and discord patterns
The matrix profile value gives important information: it is a measure of subsequence similarity.
If the value is very low at some tick, then it means that somewhere else in the time series the subsequence is very similar. And we know where that somewhere else is because the matrix profile GTS also contains its bucket index. Subsequences that arose frequently and are responsible for a low matrix profile value are called motifs.
On the other hand, if the value is high, it means that the pattern is very atypical. We call that a discord: it is a kind of anomaly in the data, but detected at the subsequence level (instead of analyzing value distributions).
To visualize the most representative motifs and discords, we made a macro named @senx/profile/dashboardSpec to create a dashboard as shown below. In addition to the input time series, it takes two other arguments: the subsequence length and the bucket span.
20 24 * 3 m @senx/profile/dashboardSpec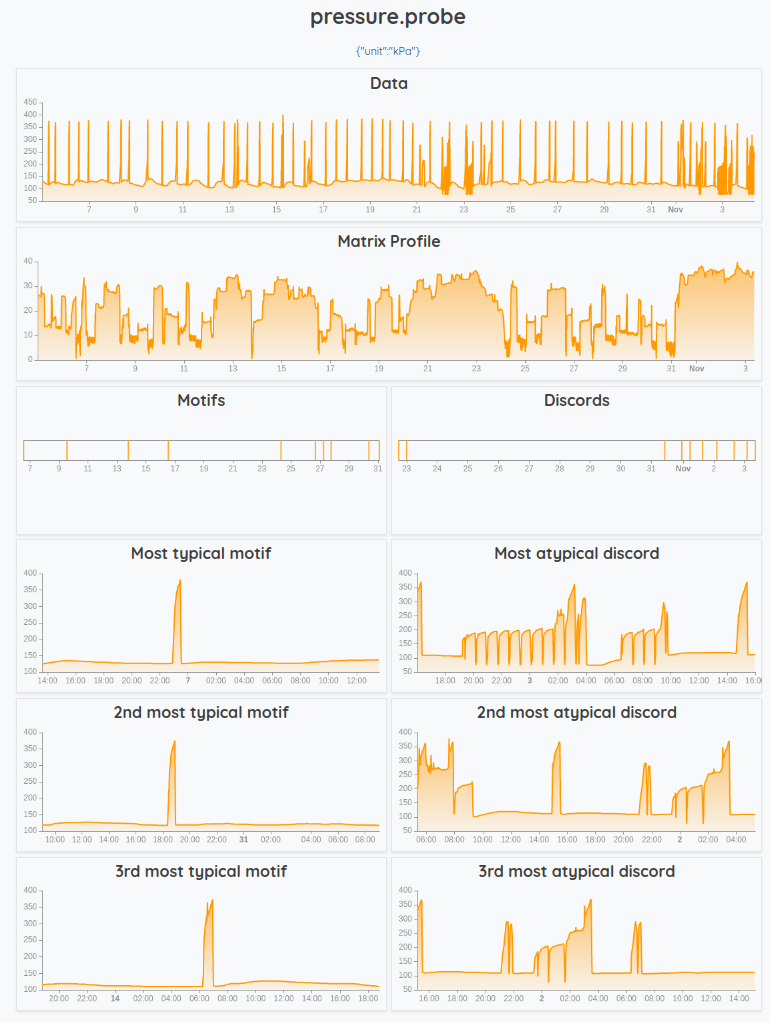
You can regenerate this dashboard using this snapshot: https://snapshot.senx.io/0005df73950787dc-0-4-449b4d771fe7d72f
To create this dashboard, the macro calls the function MP.PROFILE and the macros @senx/profile/motifs and @senx/profile/discords.
| Read more about macros |
Interpretation
When we look at the most typical motifs, we see that when the heat pump raises the pressure levels it works well: it is a small buff that does not last long and it probably helps smooth out the liquid circulation. In comparison, the pressure injection looks winded in the case of the most representative discords.
Finding these discords can be critical in monitoring the healthiness of a system. Here, when the pressure is going under 100 kPa or staying high for a long period of time, it can be a sign of a malfunctioning heat pump system that may damage it in the long term.
Going further
Since the matrix profile requires a quadratic time complexity to be computed, the extension comes with default configurable limits on the size of its inputs. You can check the description of these configurations in the repository.
The matrix profile is implemented using the STOMP algorithm that is described in this paper.
The extension also provides other functions than MP.PROFILE. The function MP.RPROFILE computes the profile of a single subsequence. The function MP.ABPROFILE produces the AB join, that is, it compares every subsequence in two input GTS. The function MP.FLUSS computes a series useful for semantic segmentation of a time series. Finally, the function MP.ATBUCKETINDEX returns the subsequence starting at a given bucket. These functions are documented on the WarpFleet page of the extension.
If you want to dig deeper in the subject, you may have a look at the research done on this subject by Keogh et al.
Read more
LevelDB extension for blazing-fast deletion
May 2020: Warp 10 release 2.6.0
Conversions to Apache Arrow format

Machine Learning Engineer