Discover how to use Warp 10 as a tiles server and plug it into Discovery
Ever wonder how to use a custom tile server for your DataViz? As you will learn, Warp 10 can act as a tile server (thanks to the HTTP Plugin) for Leaflet or Discovery.
What is a tile server?
Map display frameworks (like Leaflet or MapBox) use tiles to display parts of the map depending on the view-port and the zoom level. Public tile servers use a dynamic URL to bring back an image of the map area at given x and y coordinates (Mercator projection) and a given zoom level.
If we analyze the popular tile server OpenStreetMap, it uses a URL like this one:
https://1.tile.openstreetmap.org/5/15/11.png: https://{s}.tile.openstreetmap.org/{z}/{x}/{y}.png
Map libraries use this kind of template based on the location and the zoom level to display. The {s} part is used to have multiple servers to bypass browser parallel request limitations.
As you can see, it is quite easy to reproduce this behavior.
I also invite you to read this post to learn how to create a custom tile for Discovery.
The Warp 10 HTTP Plugin
First, you need to activate the Warp 10 HTTP Plugin. It is easy:
- Create an empty
httpdirectory, ie:/path/to/warp10/http - Edit
/path/to/warp10/etc/conf.d/80-http-plugin.confto add the following lines:
warp10.plugin.http = io.warp10.plugins.http.HTTPWarp10Plugin
http.dir = ${standalone.home}/http
http.period = 5000
http.host = 0.0.0.0
http.port = 8082- Restart Warp 10
HTTP Handler for the tile server
Create a file: /path/to/warp10/http/tiles.mc2
{
    'path' '/tiles'
    'prefix' true
    'macro' <%
    {
        'status' 200
        'headers' {
            'Access-Control-Allow-Origin' '*'
        }
        'body' 'Hello'
    }
  %>
}
You can check if it works: http://localhost:8082/tiles
Now, we will handle path parameters (x, y, and z):
{
    'path' '/tiles'
    'prefix' true
    'macro' <%
        'request' STORE // Fetch the request
        $request 'pathinfo' GET '/' SPLIT 'split_path' STORE // extract the path and split it
        $split_path -3 GET TOLONG 'z' STORE
        $split_path -2 GET TOLONG 'x' STORE
        $split_path -1 GET TOLONG 'y' STORE
        {
            'status' 200
            'headers' {
                'Access-Control-Allow-Origin' '*'
            }
            'body' {
                'x' $x
                'y' $y
                'z' $z
            } ->JSON // serialize to JSON string
        }
  %>
}
We assume our path will handle http://localhost:8082/tiles/{z}/{x}/{y}, you can try it with: http://localhost:8082/tiles/1/2/3

Generate a PNG
With Warp 10, you can produce PNGs thanks to the Processing library (More info here).
First, we must define a tile size, we chose a 256 pixels square.
We have to modify response headers to set the content type.
Then, we fill our image with color and add a text corresponding to our path parameters: zoom:{z}, x:{x}, y:{y}
And finally, we produce the actual image and convert it into binary data.
{
    'path' '/tiles'
    'prefix' true
    'macro' <%
        'request' STORE // Fetch the request
        $request 'pathinfo' GET '/' SPLIT 'split_path' STORE // extract the path and split it
        $split_path -3 GET TOLONG 'z' STORE
        $split_path -2 GET TOLONG 'x' STORE
        $split_path -1 GET TOLONG 'y' STORE
        256 'TILE_SIZE' STORE // the tile size in pixels
        $TILE_SIZE $TILE_SIZE '2D' PGraphics
        0xFF000000 Pfill // Sets the color used to fill shapes like text
        'CENTER' 'CENTER' PtextAlign // center text
        'zoom:{{{z}}}, x:{{{x}}}, y:{{{y}}}'  // Template string
        { 'z' $z 'x' $x 'y' $y }
        TEMPLATE 128 100 Ptext // build text
         Pencode // Create image
        22 SUBSTRING B64-> // Remove 'data:...' header and convert to bytes
        'response' STORE

        {
            'status' 200
            'headers' {
                'Access-Control-Allow-Origin' '*'
                'Content-Type' 'image/png'
            }
            'body' $response
        }
  %>
}
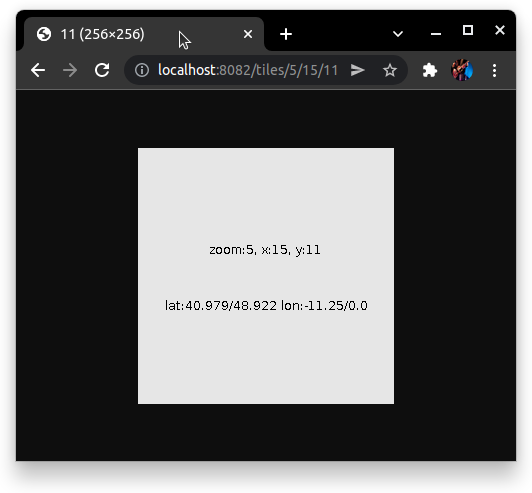
Ok, now we add the actual coordinates (ie: latitude and longitude) of the bounding box.
We have to compute the bounding box according to the zoom level and convert bounds from Mercator to lat/lon.
{
    'path' '/tiles'
    'prefix' true
    'macro' <%
        'request' STORE // Fetch the request
        $request 'pathinfo' GET '/' SPLIT 'split_path' STORE // extract the path and split it
        $split_path -3 GET TOLONG 'z' STORE
        $split_path -2 GET TOLONG 'x' STORE
        $split_path -1 GET TOLONG 'y' STORE

        2.0 $z ** 'n' STORE // zoom factor

        // compute the bounding box
        $x $n / 360.0 * 180.0 - 'tile_lon_min' STORE
        $x 1 + $n / 360.0 * 180.0 - 'tile_lon_max' STORE

        1.0 $y $n / 2 * - PI * SINH ATAN TODEGREES 'tile_lat_max' STORE
        1.0 $y 1 + $n / 2 * - PI * SINH ATAN TODEGREES 'tile_lat_min' STORE


        256 'TILE_SIZE' STORE // the tile size in pixels
        $TILE_SIZE $TILE_SIZE '2D' PGraphics
        0xFF000000 Pfill // Sets the color used to fill shapes like text
        'CENTER' 'CENTER' PtextAlign // center text
        'zoom:{{{z}}}, x:{{{x}}}, y:{{{y}}}'  // Template string
        { 'z' $z 'x' $x 'y' $y }
        TEMPLATE 128 100 Ptext // build text

        'lat:{{{lat_min}}}/{{{lat_max}}} lon:{{{lon_min}}}/{{{lon_max}}}'
        {
            'lat_min' $tile_lat_min 1000 * TOLONG 1000.0 / // an ugly way to round numbers
            'lat_max' $tile_lat_max 1000 * TOLONG 1000.0 /
            'lon_min' $tile_lon_min 1000 * TOLONG 1000.0 /
            'lon_max' $tile_lon_max 1000 * TOLONG 1000.0 /
        }
        TEMPLATE 128 156 Ptext

        // Draw a border around the image
        PnoFill 0 0 255 255 Prect

        Pencode // Create image
        22 SUBSTRING B64-> // Remove 'data:...' header and convert to bytes
        'response' STORE

        {
            'status' 200
            'headers' {
                'Access-Control-Allow-Origin' '*'
                'Content-Type' 'image/png'
            }
            'body' $response
        }
  %>
}
Discovery integration
Now it is time to display a map using our custom tiles. The easiest way is to use Discovery.
Create a single HTML file and serve it with the webserver you want. (ie: python -m SimpleHTTPServer 8000)
<html>
    <head></head>
    <body>
        <discovery-dashboard url="http://localhost:8080/api/v0/exec">
            {
                'tiles' [
                    {
                        'x' 0 'y' 0 'w' 12 'h' 4
                        'options' {
                            'map' {
                                'tiles' [ 'http://localhost:8082/tiles/{z}/{x}/{y}' ]
                            }
                        }
                        'type' 'map'
                        'macro' <% { 'data' [] } %>
                    }
                ]
            }
        </discovery-dashboard>
        <script nomodule src="https://unpkg.com/@senx/discovery-widgets/dist/discovery/discovery.js"></script>
        <script type="module" src="https://unpkg.com/@senx/discovery-widgets/dist/discovery/discovery.esm.js"></script>
    </body>
</html>
And voilà!

You can now pan and zoom in and out to see how it works.
Going further
You now know how to build a picture according to coordinates and a zoom level, how to integrate it into Discovery, and even how to compute latitudes and longitudes of the bounding box.
It is now quite easy to fetch data according to this bounding box, so you can show points or heat maps.
More articles about Discovery:
- Server monitoring with Warp 10 and Telegraf
- Santa asset tracking and delivery service
- Covid Tracker built with Warp 10 and Discovery
Full Discovery documentation is available here.
Read more
Build a WarpScript extension which embeds a C library
Warp 10 Lambda functions
Working with Time Series in Spark

Senior Software Engineer