Explore UFO sightings datasets and find correlations with US military bases location.
This is the next part of the previous article called UFO datasets, the truth is out there… about UFO sightings data manipulation.
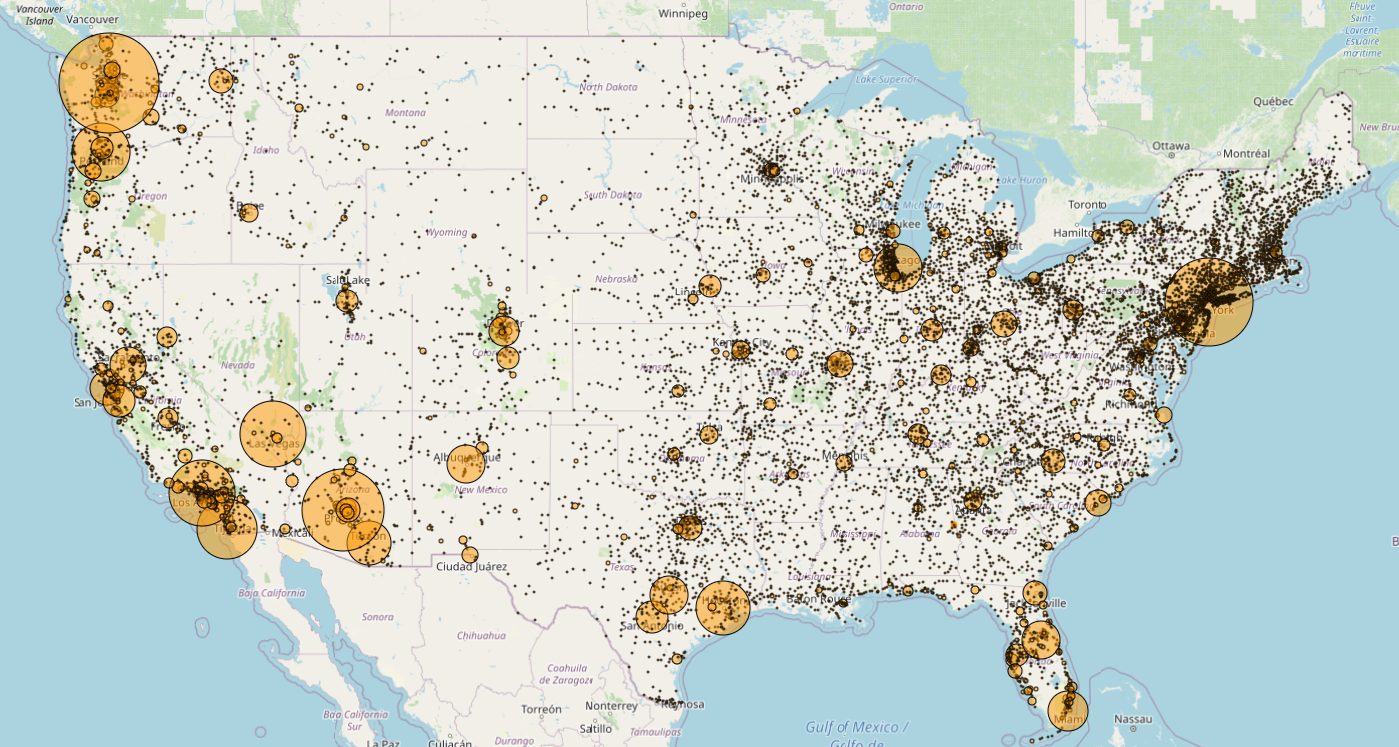
Locate UFO sightings by count all over the time
It is a bit more tricky to do, but you can achieve it in a few steps:
- Fetch data
- Map data to replace the actual value by an HHCODE with a MACROMAPPER.
- Compute the sum of sightings for each location
- Build a new artificial time series with the count as a value
'<YOUR READ TOKEN>' 'token' STORE

// Ok we are going to do a lot of computation
$token CAPADD 10000000 MAXOPS

[
  $token
  'sighting.ufo' { 'country' 'us' }
  [ 1900 01 01 ] TSELEMENTS-> ISO8601
  [ 2021 01 01 ] TSELEMENTS-> ISO8601
] FETCH
MERGE
DEDUP
'gts' STORE

// Map values into a HHCode
[
  $gts
  <%
    'point' STORE    // get datapoint's location
    $point [ 4 5 ] SUBLIST FLATTEN 'loc' STORE

    // compute HHCode
    $loc 0 GET $loc 1 GET ->HHCODE 'hhcode' STORE

    // new datapoint return with the HHCode as value
    [ $point 0 GET $loc 0 GET $loc 1 GET NaN $hhcode ]
  %> MACROMAPPER
  0 0 0
] MAP
0 GET 'hhcodeGTS' STORE

// Sum same HHCodes
$hhcodeGTS VALUEHISTOGRAM 'repartition' STORE

// create a new GTS
NEWGTS 'count.by.location' RENAME 'locGTS' STORE

// For each HHCode
$repartition
<%
  'value' STORE 'key' STORE

  // convert HHCode to lat/long
  $key HHCODE-> [ 'lat' 'long' ] STORE

  // Add the sighting count per location as value
  $locGTS NOW $lat $long NaN $value ADDVALUE
  DROP
%> FOREACH
To understand MAXOPS, please have a look at this post about limits.
DISCLAIMER
For those particular dataviz, please wait for a future post about a UFO dashboard.
Display military bases location
Now we will try to find a relationship between UFO sightings and military bases locations in the USA.
So we need a US military bases datasets, here is one: https://public.opendatasoft.com/explore/dataset/military-bases/information/
And here is the Warp 10 data to import to your instance: bases.zip.
curl \
  -H "X-Warp10-Token: <YOUR WRITE TOKEN>" \
  -H "Transfer-Encoding: chunked" \
  -T bases.gts \
  "https://sandbox.senx.io/api/v0/update"
At first, let's have a look at the datasets on a map:
'<YOUR READ TOKEN>' 'token' STORE
[
  $token
  'military.bases' { 'country' 'United States' }
  NOW -1000 // we have less than 1000 datapoints
] FETCH
MERGE 'bases' STORE

// display
[ $bases mapper.tostring 0 0 0 ] MAP 'bases' STORE
[
  {
    'key' 'military base'
    'render' 'dot'
    'color' '#f44336'
  }
]
'params' STORE

{
  'data' [ $bases ]
  'params' $params
} 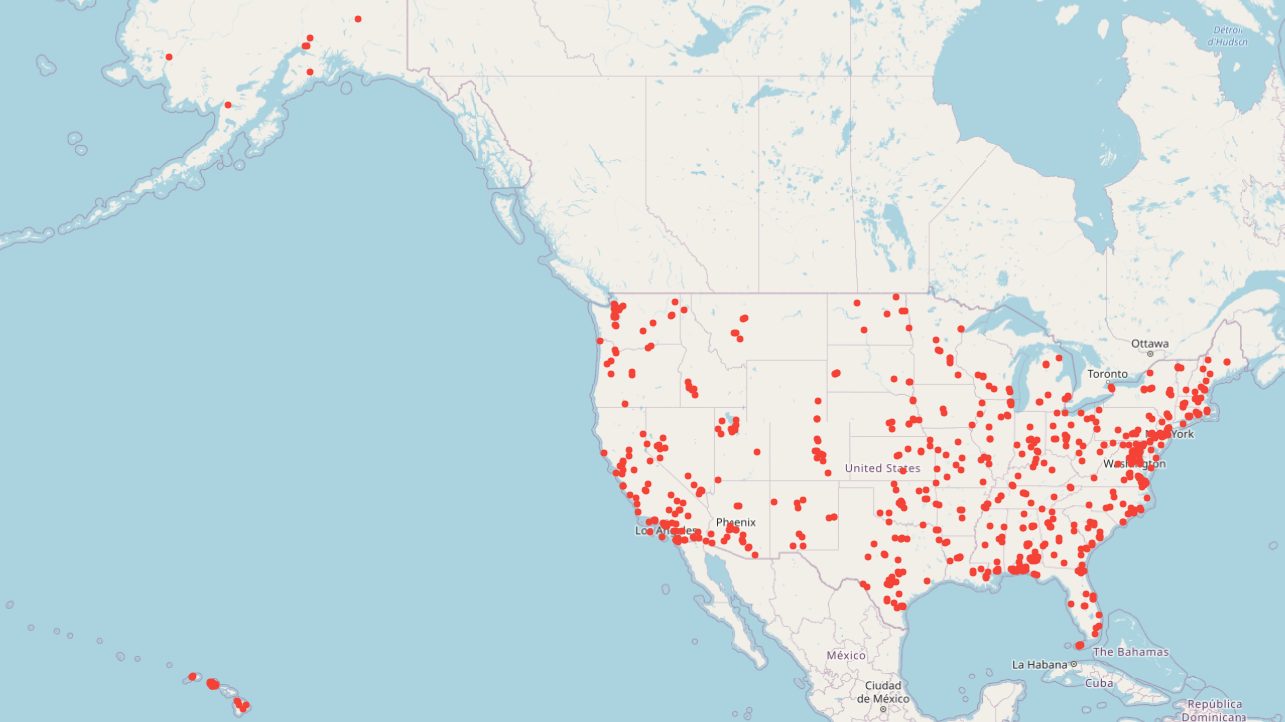
Well, it seems there is a relationship. Now let's display both.
The smartest way is to use a regular expression to fetch both bases and sightings, and then, filter the result to retain only the time series we want.
[
  $token
  '~(military.bases|sighting.ufo)' { 'country' '~(us|United States)' }
  [ 1900 01 01 ] TSELEMENTS-> ISO8601
  [ 2021 01 01 ] TSELEMENTS-> ISO8601
] FETCH
DEDUP 'gts' STORE

// extract sightings
[ $gts [] 'sighting.ufo' filter.byclass ] FILTER MERGE DEDUP 'sightings' STORE
[ $gts [] 'military.bases' filter.byclass ] FILTER MERGE DEDUP 'bases' STORE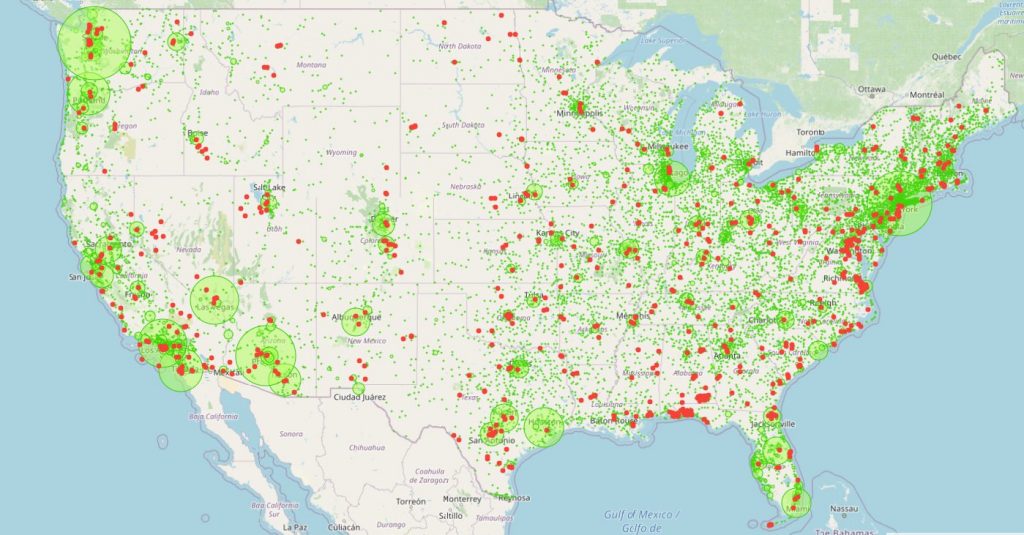
Military bases and UFO sightings relationship
Now, I would like to know how many sightings there is below 50 km of a military base.
To achieve that, here are the steps:
- Fetch data
- Filter by series
- For each military base (hopefully, they are not thousands)
- Compute a 50 km radius circle
- Aggregate those circles
- Count sightings inside those circles
- Get the overall sightings count
'<YOUR READ TOKEN>' 'token' STORE
[
  $token
  '~(military.bases|sighting.ufo)' { 'country' '~(us|United States)' }
  [ 1900 01 01 ] TSELEMENTS-> ISO8601
  [ 2021 01 01 ] TSELEMENTS-> ISO8601
] FETCH 'data' STORE

[ $data [] 'sighting.ufo' filter.byclass ] FILTER MERGE 'sightings' STORE
[ $data [] 'military.bases' filter.byclass ] FILTER MERGE 'bases' STORE

// the list of 50 km circles
[] 'listOfShapes' STORE
[
  $bases
  <%
  // get datapoint's location
  FLATTEN [ 4 5 ] SUBLIST 'loc' STORE

  // get a 50 km radius circle
  $loc 0 GET $loc 1 GET 50000 @senx/geo/circle 0.05 false GEO.WKT 'geoShape' STORE

  // append the Shape
  $listOfShapes $geoShape +!

  DROP // discard the result

  // dummy return
  [ 0 NaN NaN NaN NULL ]
  %> MACROMAPPER
  0 0 0
] MAP
DROP // discard the result

// merge shapes and optimize with a 2.5 km precision
$listOfShapes GEO.UNION 14 GEO.OPTIMIZE 'geoArea' STORE

// filter sightings to keep only those who are inside
[ $sightings $geoArea mapper.geo.within 0 0 0 ] MAP
0 GET

// count
VALUES SIZE 'near' STORE
// display
{
  '< 50 km' $near
  '> 50 km' $sightings
  VALUES SIZE $near -
}
[
{
"< 50 km": 48151,
"> 50 km": 16043
}
]Ok, but in percent? Modify the end of the previous script.
$sightings VALUES SIZE 'total' STORE

// display
{
  '< 50 km' $near 100 * $total / TOSTRING '%25' +
  '> 50 km' $total $near - 100 * $total / TOSTRING '%25' +
}
[
{
"< 50 km": "75%",
"> 50 km": "24%"
}
]75% of UFO sightings in the USA take place at less than 50 km from a military base!
That could mean two things:
- The US military bases secretly host aliens
- The US army is made of aliens
| Read more about when do you need a Time Series Database. |
Final though
With these datasets, we have seen how to do a MACROMAPPER, how to manipulate HHCODE, GeoShapes, how to filter data by a geographic area, and how to compute the value distribution.
Like said before, in a future post, we will build a UFO dashboard with all of what we discovered.
Live long and prosper.
Part 3 of UFO sightings datasets is right here.
Read more
An AIS data set for the 2022 Ocean Hackathon
Working with GEOSHAPEs
Les séries temporelles : le futur de la donnée

Senior Software Engineer