Regularly, people talk about UFOs, some of us believe having seen one of them. These phenomena last since the WW2. UFO sightings across the world is a nice dataset to discover and experiment data manipulation and correlation with Warp 10.
Regularly, people talk about UFOs, some of us believe having seen one of them. This phenomenon lasts since the WW2.
There is a UFO dataset which represents 80 thousand UFO sightings over the world, with a date, a location, and some extra info.
Upload UFO datasets
First import it into Warp 10 (thanks to the sandbox, you can do it easily):
- Go to https://sandbox.senx.io/ and create a Sandbox. Copy-paste somewhere the 3 generated tokens (especially, the read and the write one)
- Download this UFO datasets: ufo.zip
- Unzip it and push data into the Sandbox:
curl \
  -H "X-Warp10-Token: <YOUR WRITE TOKEN>" \
  -H "Transfer-Encoding: chunked" \
  -T ufo.gts \
  "https://sandbox.senx.io/api/v0/update"
Now, you have data on our SandBox.
Here is the data model:
- class name: sighting.ufo
- labels:
- state (mostly for the US, but I do not want to spoil some analysis results)
- country
- shape (the shape of what they see, like a triangle, a circle, a pink duck, and so on)
- datapoint: date of observation / latitude : longitude / and the duration of the observation as a value
| Read more about what in the world is a Time Series Database. |
First analysis
First, I would like to know the country where there were the most sightings. You can use either https://studio.senx.io/ or our VSCode plugin.
With WarpScript, it takes 4 steps:
- Fetch data
- Bucketize it in a single big bucket and compute the data points count
- Reduce by country and compute the sum of data points counts
- Prettify the result
'<YOUR READ TOKEN>' 'token' STORE

// first step
[
  $token
  'sighting.ufo' {}
  [ 1900 01 01 ] TSELEMENTS-> ISO8601
  [ 2020 01 01 ] TSELEMENTS-> ISO8601
] FETCH 'gts' STORE

// second step
[ $gts bucketizer.count NOW 0 1 ] BUCKETIZE 'bucketized' STORE

// third step
[ $bucketized [ 'country' ] reducer.sum ] REDUCE 'reduced' STORE

// prettify the result
{
  $reduced <%
    'result' STORE
    $result LABELS 'country' GET
    $result VALUES 0 GET
  %> FOREACH
}
[
{
"au": 536,
"gb": 1894,
"us": 64194,
"ca": 2974,
"de": 105,
"": 9618
}
]Ok, the winner is surprisingly the USA.
This could mean one of two things:
- A large amount of Americans are reptilian alien
- The US government is in cahoots with aliens and is using their technology to maintain their status as a global superpower
Second analysis
How sightings evolve during time, with a monthly aggregation? 3 steps:
- Fetch data
- Bucketize it by month and compute the data points count (i.e.: month count aggregation)
- Reduce by country and compute the sum of data points counts
'<YOUR READ TOKEN>' 'token' STORE

// first step
[
  $token
  'sighting.ufo' {}
  [ 1900 01 01 ] TSELEMENTS-> ISO8601
  [ 2020 01 01 ] TSELEMENTS-> ISO8601
] FETCH 'gts' STORE

// second step
[ $gts bucketizer.count ] @senx/cal/BUCKETIZE.bymonth
UNBUCKETIZE.CALENDAR 'bucketized' STORE
[ $bucketized [ 'country' ] reducer.sum ] REDUCE

Ok, it happens mostly at the end of century, and it seems that there is some kind of seasonality. Now, focus on the USA. In which US state do UFO sightings occur the most?
'<YOUR READ TOKEN>' 'token' STORE

// first step
[
  $token
  'sighting.ufo' { 'country' 'us' }
  [ 1940 01 01 ] TSELEMENTS-> ISO8601
  [ 2021 01 01 ] TSELEMENTS-> ISO8601
] FETCH 'gts' STORE

// second step
[ $gts bucketizer.count NOW 0 1 ] BUCKETIZE 'bucketized' STORE

// Fill gaps
$bucketized [ NaN NaN NaN 0 ] FILLVALUE
'filled' STORE

[ $filled [ 'state' ] reducer.sum ] REDUCE

// prettify the result
// sort by values
<% VALUES 0 GET %> SORTBY

// descending order
REVERSE

// keep only the five first series
[ 0 5 ] SUBLIST 'sorted' STORE
{
  $sorted <%
    'result' STORE
    $result LABELS 'state' GET
    $result VALUES 0 GET
  %> FOREACH
}
[
    {
        "ca": 8787,
        "wa": 3882,
        "fl": 3787,
        "tx": 3410,
        "ny": 2936,
        "il": 2395
    }
]
Cross data
What are the top states for UFO sightings relative to state population?
'<YOUR READ TOKEN>' 'token' STORE
{
  'al' 4872725
  'ak' 746079
  'az' 7044577
  'ar' 2998643
  'ca' 39506094
  'co' 5632271
  'ct' 3568174
  'de' 960054
  'dc' 691963
  'fl' 20979964
  'ga' 10421344
  'hi' 1431957
  'id' 1713452
  'il' 12764031
  'in' 6653338
  'ia' 3147389
  'ks' 2907857
  'ky' 4449337
  'la' 4694372
  'me' 1333505
  'md' 6037911
  'ma' 6839318
  'mi' 9938885
  'mn' 5557469
  'ms' 2988062
  'mo' 6109796
  'mt' 1052967
  'ne' 1920467
  'nv' 2996358
  'nh' 1339479
  'nj' 8953517
  'nm' 2081702
  'ny' 19743395
  'nc' 10258390
  'nd' 759069
  'oh' 11623656
  'ok' 3939708
  'or' 4162296
  'pa' 12776550
  'pr' 3661538
  'ri' 1057245
  'sc' 5027404
  'sd' 872989
  'tn' 6707332
  'tx' 28295553
  'ut' 3111802
  'vt' 623100
  'va' 8456029
  'wa' 7415710
  'wv' 1821151
  'wi' 5789525
  'wy' 584447
} 'statePop' STORE

// first step
[
  $token
  'sighting.ufo' { 'country' 'us' }
  [ 1940 01 01 ] TSELEMENTS-> ISO8601
  [ 2021 01 01 ] TSELEMENTS-> ISO8601
] FETCH 'gts' STORE

// second step
[ $gts bucketizer.count NOW 0 1 ] BUCKETIZE 'bucketized' STORE

// Fill gaps
$bucketized [ NaN NaN NaN 0 ] FILLVALUE  'filled' STORE
[ $filled [ 'state' ] reducer.sum ] REDUCE 'reduced' STORE

  // Map values
[
  $reduced
  <%
    // ok a bit tricky here, refer to the doc
    'data' STORE    $data 2 GET 0 GET 'state' GET 'state' STORE
    // get the state
    $statePop $state GET TODOUBLE 'pop' STORE //get the population
    // compute the propotion of population
    $data 7 GET 0 GET TODOUBLE 'value' STORE
    $value $pop / 100.0 * 'newValue' STORE
    [ $data 0 GET NaN NaN NaN $newValue ]
  %>
  MACROMAPPER
  0 0 0
] MAP

// prettify the result
// sort by values
<% VALUES 0 GET %> SORTBY
// descending order
REVERSE // keep only the five first series
[ 0 5 ] SUBLIST 'sorted' STORE
{
  $sorted <%
    'result' STORE
    $result LABELS 'state' GET
    $result VALUES 0 GET
  %> FOREACH
}
[
{
"wa": 0.052348325379498385,
"mt": 0.044920686023398645,
"ak": 0.04181862778606555,
"or": 0.04153957335086212,
"me": 0.04131968009118826,
"vt": 0.041084898090194194
}
]Seasonality
Is there a particular period for UFO flights? Here is the process:
- Fetch data
- Bucketize and fill gaps
- Reduce
- Split by year
- Shift the time to 01/01/1970
- Bucketize to align timestamps and reduce
'<YOUR READ TOKEN>' 'token' STORE

// get data
[
  $token
  'sighting.ufo' { 'country' 'us' }
  [ 1950 01 01 ] TSELEMENTS-> ISO8601
  [ 2021 01 01 ] TSELEMENTS-> ISO8601
] FETCH 'gts' STORE

// bucketize and fill gaps
[ $gts bucketizer.count ] @senx/cal/BUCKETIZE.bymonth
UNBUCKETIZE.CALENDAR [ NaN NaN NaN 0 ] FILLVALUE 'bucketized' STORE

// reduce
[ $bucketized [] reducer.sum ] REDUCE 0 GET

// split by year
'Europe/Paris' @senx/cal/byyear

// align all on 01/01/1970
<% 'g' STORE $g 0 $g FIRSTTICK - TIMESHIFT %> F LMAP

// bucketize
[ SWAP bucketizer.sum ] @senx/cal/BUCKETIZE.bymonth

// reduce
[ SWAP [] reducer.sum ] REDUCE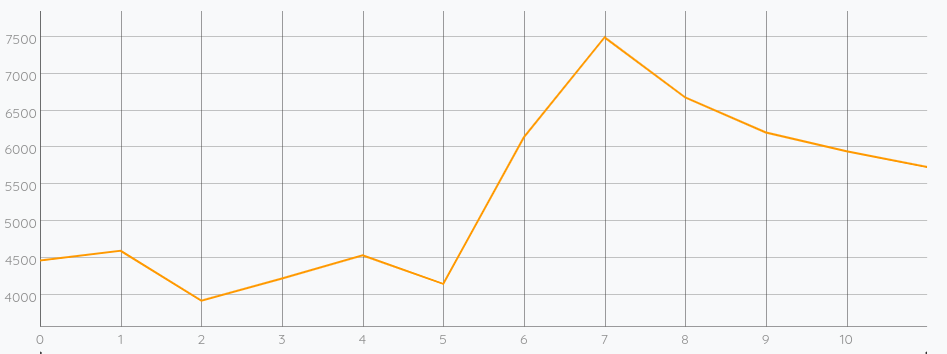
Well, they like Christmas and the summer.
Correlation
Is there a correlation with alien movies?
So, here is TheMovieDB datasets with the "UFO" search term. movies.zip. Download it and upload your data.
Now I would like to compare evolution of each curve:
UFO sightings:
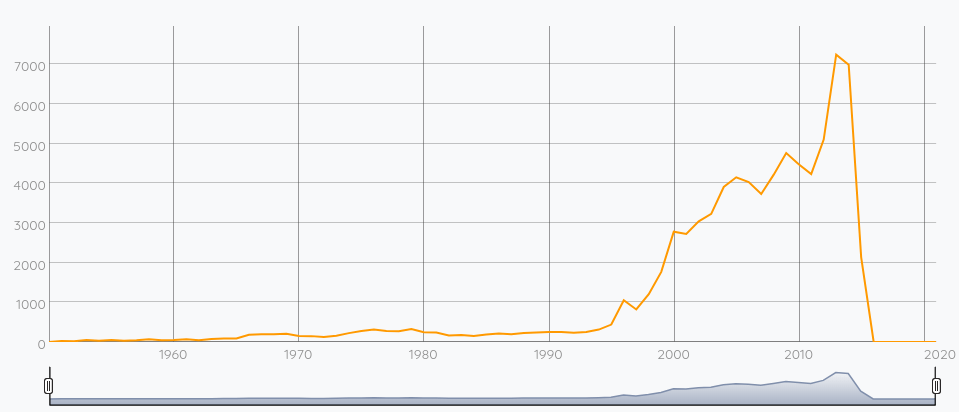
UFO movies releases:
It seems there is something. Now, I put both series on the same chart:
'<YOUR READ TOKEN>' 'token' STORE

// get data
[
  $token
  '~(ufo.movies|sighting.ufo)' {}
  [ 1950 01 01 ] TSELEMENTS-> ISO8601
  [ 2021 01 01 ] TSELEMENTS-> ISO8601
] FETCH 'gts' STORE

// bucketize per year count
[ $gts bucketizer.count [ 2021 01 01 ] TSELEMENTS-> 365 d  0 ] BUCKETIZE

// fill gaps
[ NaN NaN NaN 0 ] FILLVALUE 'bucketized' STORE

// keep movies
[ $bucketized [] 'ufo.movies' filter.byclass ] FILTER 'movies' STORE

// keep sightings
[ $bucketized [] 'sighting.ufo' filter.byclass ] FILTER 'sightings' STORE

// reduce sightings
[ $sightings [] reducer.sum ] REDUCE 'sightings' STORE

// and display
$movies
$sightings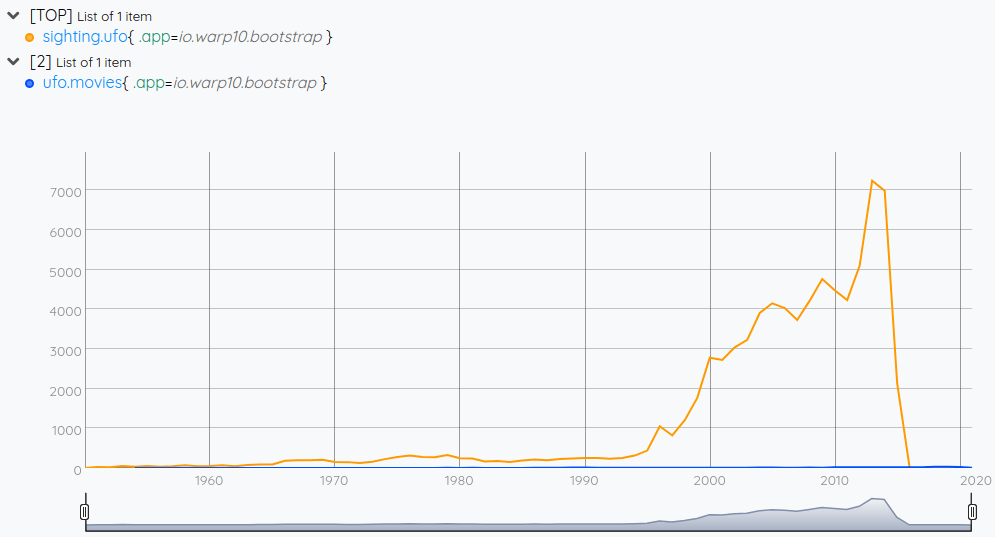
Oh, they are not on the same scale. Obviously, there's less movie releases per year than UFO sightings. Here is a way to compare them:
// reduce sightings
// ... previous code
$movies NORMALIZE
$sightings NORMALIZE
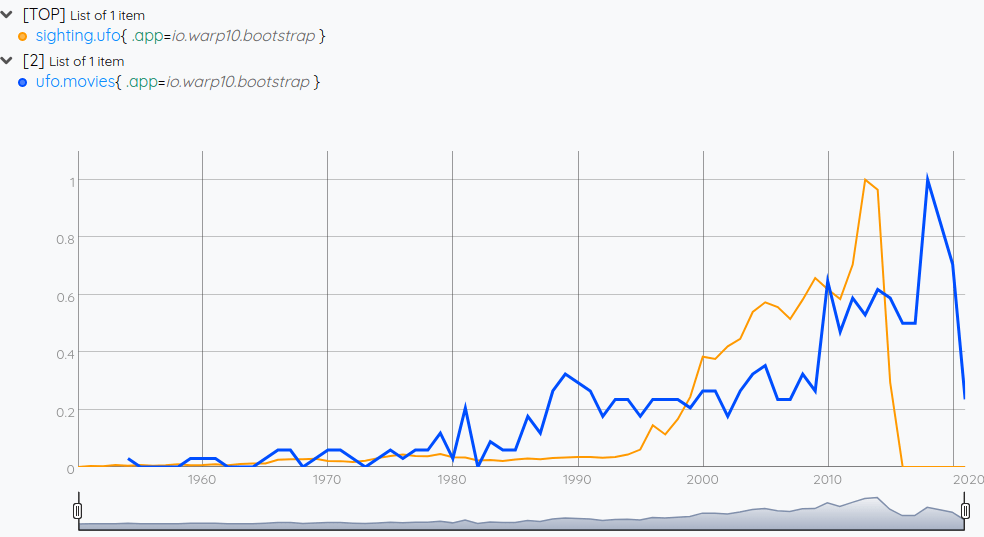
We have to look a bit further by zooming on two eras:
The last century:
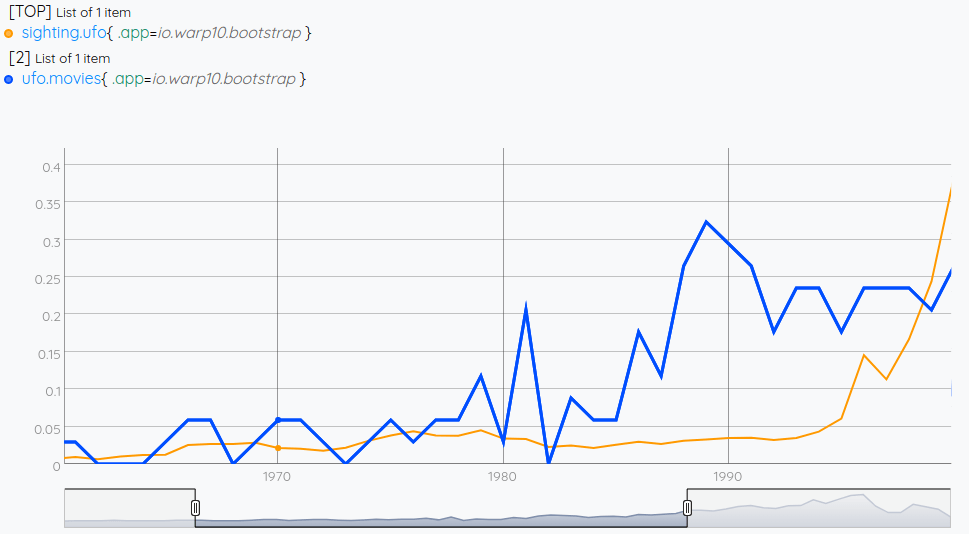
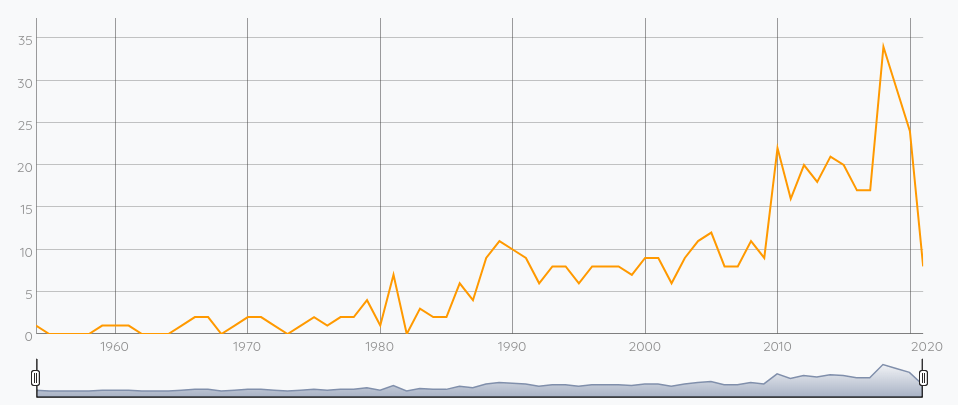
It seems that sightings are a consequence of Hollywood movie production. In fact, this is a common social theory about the UFO observation phenomena. But for this century:

It seems that Hollywood reacts to people by producing movies about a spread interest.
Final thought about this UFO datasets
I am not a sociologist but, with the power and the simplicity of WarpScript, we have done some data manipulations.
UFO sightings across the world is a nice dataset to discover and experiment data manipulation and correlation with Warp 10. Share on XThese UFO datasets were just a pretext to introduce common Time Series concepts like:
In a future post, I will correlate sightings location with military bases position.
Live long and prosper.
With the help of https://www.kaggle.com/hakeemtfrank/ufo-sightings-data-exploration
Part 2 of UFO sightings datasets is right here.
Read more
High Performance Sailing Monitoring for the Vendée Globe
Santa asset tracking and delivery service
Video Streaming with Warp 10

Senior Software Engineer