In previous posts we manipulated UFO datasets, now we show you how to display your analysis.
Article updated on June 22, 2023
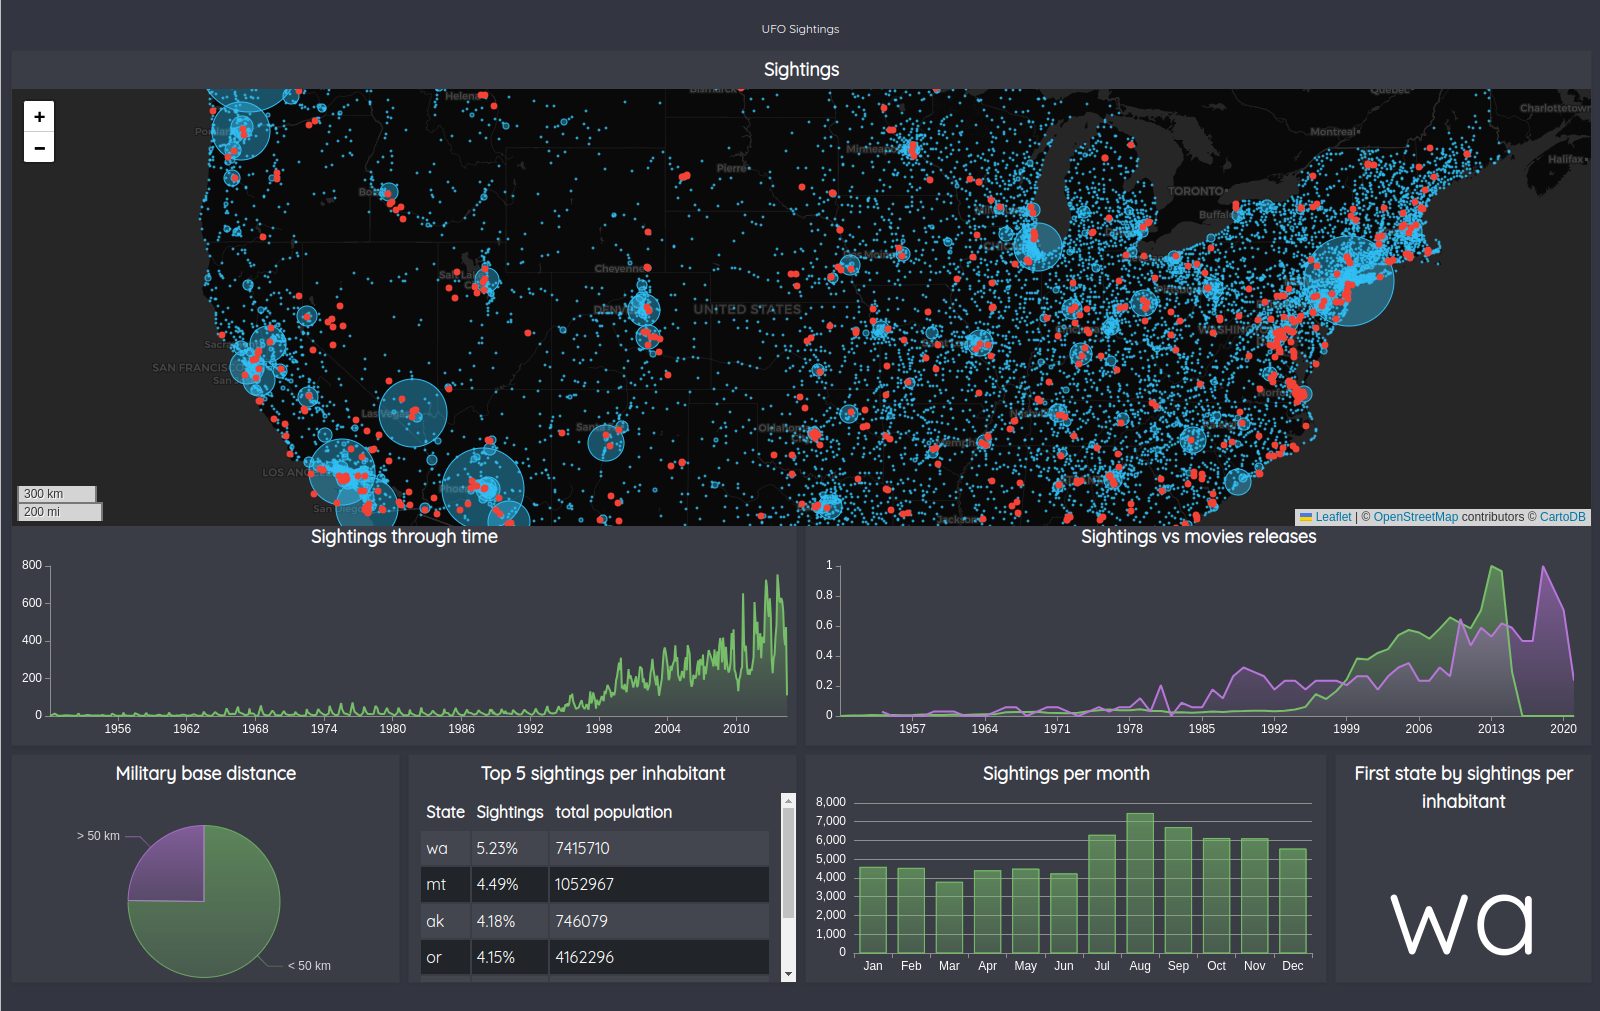
After having manipulated UFO data in Part 1 and Part 2, it is time to build a dashboard like this one:
All the following WarpScript are explained in the previous posts about UFO datasets.
In order to build this dataviz, we will use Discovery and WarpStudio.
In WarpStudio, select the Sandbox and use the "discovery" snippet to bootstrap a dashboard.
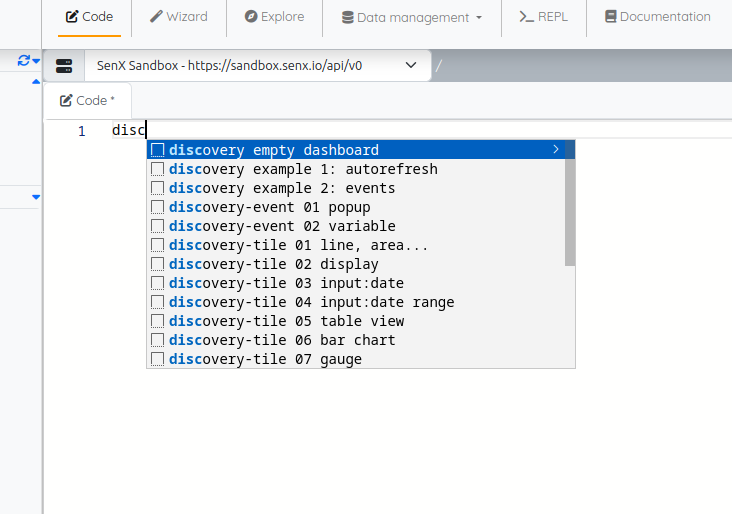
After some code cleanup, you should have a code like this:
// @endpoint https://sandbox.senx.io/api/v0/exec
// @preview discovery
// @theme dark
{
  'title' 'UFO'
  'description' 'UFO Sightings'
  'vars' {
    'token' 'Your Read Token'
  }
  'options' { 'showErrors' true 'scheme' 'CHARTANA' }
  'tiles' [ ]
}
First tile: the map
In the 'tile' array, add a new map tile:
 {
      'title' 'Sightings'
      'type' 'map'
      'x' 0 'y' 0 'w' 12 'h' 2
      'options'  {
        'map'  { // Center on the US and apply a dark theme
          "startLat" 39.8364989
          "startLong" -98.3276331
          "startZoom" 5
          'mapType' 'CARTODB_DARK'
        }
      }
      'macro' <%
      %>
  }
In the 'macro' area, you can add the code of the previous post:
       $token CAPADD 10000000 MAXOPS
        [
          $token
          '~(military.bases|sighting.ufo)' { 'country' '~(us|United States)' }
          [ 1900 01 01 ] TSELEMENTS-> ISO8601
          [ 2021 01 01 ] TSELEMENTS-> ISO8601
        ] FETCH 'gts' STORE
        [ $gts [] 'sighting.ufo' filter.byclass ] FILTER MERGE DEDUP 'sightings' STORE
        [ $gts [] 'military.bases' filter.byclass ] FILTER MERGE DEDUP 'bases' STORE
        [ $sightings <%
            'point' STORE
            // get datapoint's location
            $point [ 4 5 ] SUBLIST FLATTEN 'loc' STORE
            // compute HHCode
            $loc 0 GET $loc 1 GET ->HHCODE 'hhcode' STORE
            // new datapoint return with the HHCode as value
            [ $point 0 GET $loc 0 GET $loc 1 GET NaN $hhcode ]
        %> MACROMAPPER 0 0 0 ] MAP 0 GET 'hhcodeGTS' STORE
        // Sum same HHCodes
        $hhcodeGTS VALUEHISTOGRAM 'repartition' STORE
        // create a new GTS
        NEWGTS 'count.by.location' RENAME 'locGTS' STORE
        // For each HHCode
        $repartition <%
          'value' STORE 'key' STORE
          // convert HHCode to lat/long
          $key HHCODE-> [ 'lat' 'long' ] STORE
          // Add the sighting count per location as value
          $locGTS NOW $lat $long NaN $value ADDVALUE DROP
        %> FOREACH
        // display
        $locGTS 'ufo' STORE
And the add some customization at the end:
       [
          {
            'key' 'sightings'
            'render' 'weightedDots'
            "color" "#31C0F6cc"
            "borderColor" "#31C0F6"
            "maxValue" $repartition VALUELIST MAX
            "minValue" 0
          }
          {
            'key' 'bases'
            'render' 'dots'
            "color" "#f44336"
            "line" false
          }
        ] 'params' STORE
        {
          'data' [ $ufo $bases ]
          'params' $params
        }
Second tile: Sightings through time
Add another tile to the 'tile' array:
{
      'title' 'Sightings through time'
      'x' 0 'y' 2 'w' 6 'h' 1
      'type' 'area'
      'macro' <%
        [
          $token
          'sighting.ufo' { 'country' 'us' }
          [ 1950 01 01 ] TSELEMENTS-> ISO8601
          [ 2021 01 01 ] TSELEMENTS-> ISO8601
        ] FETCH 'gts' STORE
        // bucketize and fill gaps
        [ $gts bucketizer.count ] @senx/cal/BUCKETIZE.bymonth UNBUCKETIZE.CALENDAR
        [ NaN NaN NaN 0 ] FILLVALUE 'bucketized' STORE
        // reduce
        [ $bucketized [] reducer.sum ] REDUCE
      %>
    }
Yet another tile: Sightings vs movies releases
{
      'title' 'Sightings vs movies releases'
      'x' 6 'y' 2 'w' 6 'h' 1
      'type' 'area'
      'macro' <%
        [ $token '~(ufo.movies|sighting.ufo)' {} [ 1950 01 01 ] TSELEMENTS-> ISO8601 [ 2021 01 01 ] TSELEMENTS-> ISO8601 ] FETCH 'gts' STORE
        [ $gts bucketizer.count [ 2021 01 01 ] TSELEMENTS-> 365 d 0 ] BUCKETIZE
        [ NaN NaN NaN 0 ] FILLVALUE SORT 'bucketized' STORE
        [ $bucketized [] 'ufo.movies' filter.byclass ] FILTER 'movies' STORE
        [ $bucketized [] 'sighting.ufo' filter.byclass ] FILTER 'sightings' STORE
        [ $sightings [] reducer.sum ] REDUCE 'sightings' STORE
        $movies NORMALIZE
        $sightings NORMALIZE
      %>
    }
And so on for other tiles
Military base distance:
{
      'title' 'Military base distance'
      'x' 0 'y' 3 'w' 3 'h' 1
      'type' 'pie'
      'macro' <%
        [
          $token
          '~(military.bases|sighting.ufo)' { 'country' '~(us|United States)' }
          [ 1900 01 01 ] TSELEMENTS-> ISO8601
          [ 2021 01 01 ] TSELEMENTS-> ISO8601
        ] FETCH 'data' STORE

        [ $data [] 'sighting.ufo' filter.byclass ] FILTER MERGE DEDUP 'sightings' STORE
        [ $data [] 'military.bases' filter.byclass ] FILTER MERGE DEDUP 'bases' STORE

        [] 'listOfShapes' STORE

        [ $bases <%
          // get datapoint's location
          FLATTEN [ 4 5 ] SUBLIST 'loc' STORE
          // get a 50 km radius circle
          $loc 0 GET $loc 1 GET 50000 @senx/geo/circle 0.05 false GEO.WKT 'geoShape' STORE
          // append the Shape
          $listOfShapes $geoShape +! DROP // discard the result
          // dummy return
          [ 0 NaN NaN NaN NULL ]
        %> MACROMAPPER 0 0 0 ] MAP DROP // discard the result
        // merge shapes and optimize with a 2.5 km precision
        $listOfShapes GEO.UNION 14 GEO.OPTIMIZE 'geoArea' STORE
        // filter sightings to keep only those who are inside
        [ $sightings $geoArea mapper.geo.within 0 0 0 ] MAP 0 GET
        // count
        VALUES SIZE 'near' STORE
        // display
        {
          'data' [
            { 'key' '< 50 km' 'value' $near }
            { 'key' '> 50 km' 'value' $sightings VALUES SIZE $near - }
          ]
        }
      %>
    }
Top 5 sightings per inhabitant:
{
      'title' 'Top 5 sightings per inhabitant'
      'x' 3 'y' 3 'w' 3 'h' 1
      'type' 'tabular'
      'macro' <%
        {
          'al' 4872725 'ak' 746079 'az' 7044577 'ar' 2998643 'ca' 39506094
          'co' 5632271 'ct' 3568174 'de' 960054 'dc' 691963 'fl' 20979964
          'ga' 10421344 'hi' 1431957 'id' 1713452 'il' 12764031 'in' 6653338
          'ia' 3147389 'ks' 2907857 'ky' 4449337 'la' 4694372 'me' 1333505
          'md' 6037911 'ma' 6839318 'mi' 9938885 'mn' 5557469 'ms' 2988062
          'mo' 6109796 'mt' 1052967 'ne' 1920467 'nv' 2996358 'nh' 1339479
          'nj' 8953517 'nm' 2081702 'ny' 19743395 'nc' 10258390 'nd' 759069
          'oh' 11623656 'ok' 3939708 'or' 4162296 'pa' 12776550 'pr' 3661538
          'ri' 1057245 'sc' 5027404 'sd' 872989 'tn' 6707332 'tx' 28295553
          'ut' 3111802 'vt' 623100 'va' 8456029 'wa' 7415710 'wv' 1821151
          'wi' 5789525 'wy' 584447
        } 'statePop' STORE

        [ $token 'sighting.ufo' { 'country' 'us' } [ 1940 01 01 ] TSELEMENTS-> ISO8601 [ 2021 01 01 ] TSELEMENTS-> ISO8601 ] FETCH 'gts' STORE
        [ $gts bucketizer.count NOW 0 1 ] BUCKETIZE 'bucketized' STORE
        $bucketized [ NaN NaN NaN 0 ] FILLVALUE 'filled' STORE
        [ $filled [ 'state' ] reducer.sum ] REDUCE 'reduced' STORE
        [ $reduced <% // ok a bit tricky here, refer to the doc
          'data' STORE
          $data 2 GET 0 GET 'state' GET 'state' STORE // get the state
          $statePop $state GET TODOUBLE 'pop' STORE //get the population
          // compute the propotion of population
          $data 7 GET 0 GET TODOUBLE 'value' STORE
          $value $pop / 100.0 * 'newValue' STORE
          [ $data 0 GET NaN NaN NaN $newValue ]
        %> MACROMAPPER 0 0 0 ] MAP
        // prettify the result
        // sort by values
        <% VALUES 0 GET %> SORTBY
        // descending order
        REVERSE 0 5 SUBLIST <%
          'gts' STORE
          $gts LABELS 'state' GET 'state' STORE
          [ $state $gts VALUES 0 GET 10000 * ROUND 100.0 / TOSTRING '%25' + $statePop $state GET ]
        %> F LMAP 'data' STORE
        {
          'data' [
            {
              'title' ''
              'columns' [ 'State' 'Sightings' 'total population' ]
              'rows' $data
            }
          ]
        }
      %>
    }
Sightings per month:
{
      'title' 'Sightings per month'
      'x' 6 'y' 3 'w' 4 'h' 1
      'type' 'bar'
      'macro' <%
        [ $token 'sighting.ufo' { 'country' 'us' } [ 1950 01 01 ] TSELEMENTS-> ISO8601 [ 2021 01 01 ] TSELEMENTS-> ISO8601 ] FETCH 'gts' STORE
        [ $gts bucketizer.count ] @senx/cal/BUCKETIZE.bymonth UNBUCKETIZE.CALENDAR
        [ NaN NaN NaN 0 ] FILLVALUE 'bucketized' STORE
        [ $bucketized [] reducer.sum ] REDUCE 0 GET
        'Europe/Paris' @senx/cal/byyear
        <% 'g' STORE $g 0 $g FIRSTTICK - TIMESHIFT %> F LMAP
        [ SWAP bucketizer.sum ] @senx/cal/BUCKETIZE.bymonth
        [ SWAP [] reducer.sum ] REDUCE 'gts' STORE
        [ 'Jan' 'Feb' 'Mar' 'Apr' 'May' 'Jun' 'Jul' 'Aug' 'Sep' 'Oct' 'Nov' 'Dec' ] $gts VALUES FLATTEN 2 ->LIST ZIP 'data' STORE
        {
          'title' ''
          'columns'  [ '' ]
          'rows'  $data
        } 'values' STORE
        { 'data' [ $values ] }
      %>
    }
And finally, the first state by sightings per inhabitant:
{
      'title' 'First state by sightings per inhabitant'
      'x' 10 'y' 3 'w' 2 'h' 1
      'type' 'display'
      'macro' <%
        {
          'al' 4872725 'ak' 746079 'az' 7044577 'ar' 2998643 'ca' 39506094
          'co' 5632271 'ct' 3568174 'de' 960054 'dc' 691963 'fl' 20979964
          'ga' 10421344 'hi' 1431957 'id' 1713452 'il' 12764031 'in' 6653338
          'ia' 3147389 'ks' 2907857 'ky' 4449337 'la' 4694372 'me' 1333505
          'md' 6037911 'ma' 6839318 'mi' 9938885 'mn' 5557469 'ms' 2988062
          'mo' 6109796 'mt' 1052967 'ne' 1920467 'nv' 2996358 'nh' 1339479
          'nj' 8953517 'nm' 2081702 'ny' 19743395 'nc' 10258390 'nd' 759069
          'oh' 11623656 'ok' 3939708 'or' 4162296 'pa' 12776550 'pr' 3661538
          'ri' 1057245 'sc' 5027404 'sd' 872989 'tn' 6707332 'tx' 28295553
          'ut' 3111802 'vt' 623100 'va' 8456029 'wa' 7415710 'wv' 1821151
          'wi' 5789525 'wy' 584447
        } 'statePop' STORE
        [ $token 'sighting.ufo' { 'country' 'us' } [ 1940 01 01 ] TSELEMENTS-> ISO8601 [ 2021 01 01 ] TSELEMENTS-> ISO8601 ] FETCH 'gts' STORE
        [ $gts bucketizer.count NOW 0 1 ] BUCKETIZE 'bucketized' STORE
        $bucketized [ NaN NaN NaN 0 ] FILLVALUE 'filled' STORE
        [ $filled [ 'state' ] reducer.sum ] REDUCE 'reduced' STORE
        [ $reduced <% // ok a bit tricky here, refer to the doc
          'data' STORE
          $data 2 GET 0 GET 'state' GET 'state' STORE // get the state
          $statePop $state GET TODOUBLE 'pop' STORE //get the population
          // compute the propotion of population
          $data 7 GET 0 GET TODOUBLE 'value' STORE
          $value $pop / 100.0 * 'newValue' STORE
          [ $data 0 GET NaN NaN NaN $newValue ]
        %> MACROMAPPER 0 0 0 ] MAP
        // sort by values descending order
        <% VALUES 0 GET %> SORTBY REVERSE 0 GET LABELS 'state' GET
      %>
    }
Here you are, you can find the complete example here.
Final thought
Of course, inserting tokens directly in your Web page is bad practice. You have to hide the token:
- By calling macros
- By protecting secrets
- Or something else (you can contact us, we have plenty of ideas about that).
Let us know what kind of dataviz you made with Discovery.
Live long and prosper.
Read more
W. Files Conspiracy vol. 1: Chemtrails Locator
Analyze your electrical consumption from your Linky and Warp 10
Traffic data for Smart Cities

Senior Software Engineer