Build a Santa tracker from scratch with Warp 10 and Discovery. Technics for asset tracking with a real-time monitoring dashboard.
Thanks to Warp 10 and Discovery, we will show you how to build a Santa tracker. Here are some technics for asset tracking with a real-time monitoring dashboard.
Like every year, on Christmas Eve, my children are totally excited and wait for Santa. In order to focus them on something, I used to cast either Google Santa Tracker or the NORAD's one. There are sadly no public API, but, Google provides an undocumented one: https://storage.googleapis.com/santa/route-v1/santa_en.json
The structure is pretty simple and looks like this:
{
  "destinations": [
    {
      "arrival": 31536000000,
      "presentsDelivered": 0,
      "city": "Santa's Village",
      "region": "North Pole",
      "location": {
        "lat": 84.6,
        "lng": 168
       }
    },
    {
      "arrival": 1514110140000,
      "presentsDelivered": 46415,
      "city": "Provideniya",
      "region": "Russia",
      "location": {
        "lat": 64.436249,
        "lng": -173.233337
      }
    ...
  ],
"stream": [
		{
			"timestamp": 1514109643152,
			"status": "Just getting started"
		},
		{
			"timestamp": 1514109678979,
			"status": "All bundled up and ready for take off!"
		},
...
]
}
Well, it is easy to parse.
The data parser
We will produce 2 series:
- The Santa track itself with its location across the world, indexed by a timestamp. We will use the number of delivered gifts as value.
- The Santa quotes, indexed with a timestamp and with a serialized JSON string corresponding to the quote as value (yes, it is ugly).
You will need NodeJS for this sample, but feel free to use the language you want.
$ mkdir santa
$ cd santa
$ npm init
$ npm install --save dayjs
Create a new file called index.js:
const fs = require('fs')
const dayjs = require('dayjs')

fs.readFile('./santa_en.json', (err, data) => {
    if (err) throw err;
    let santa = JSON.parse(data);
    const gts = santa.destinations.map((d,i) => `${(i ===0 ? d.departure: d.arrival) * 1000}/${d.location.lat}:${d.location.lng}/ santa.tracker{} ${d.presentsDelivered}`);
    console.log(gts.join('\n'));
    const gtstreams = santa.stream.map(d => `${d.timestamp * 1000}// santa.stream{} "${encodeURIComponent(JSON.stringify(d))}"`);
    console.log(gtstreams.join('\n'));
});
And run it:
node index.js > data.gtsThe result is:
1514109600000000/84.6:168/ santa.tracker{} 0
1514110140000000/64.436249:-173.233337/ santa.tracker{} 46415
1514110500000000/64.736656:177.477371/ santa.tracker{} 205774
...
1514109643152000// santa.stream{} "%7B%22timestamp%22%3A1514109643152%2C%22status%22%3A%22Just%20getting%20started%22%7D"
1514109678979000// santa.stream{} "%7B%22timestamp%22%3A1514109678979%2C%22status%22%3A%22All%20bundled%20up%20and%20ready%20for%20take%20off!%22%7D"
1514109736773000// santa.stream{} "%7B%22timestamp%22%3A1514109736773%2C%22status%22%3A%22Checking%20his%20list%22%7D"
....
Go to https://sandbox.senx.io/, grab your tokens.
| Learn more about the Warp 10 Sandbox |
And upload data:
curl \
-H "X-Warp10-Token: <your WRITE token>" \
-H "Transfer-Encoding: chunked" \
-T data.gts \
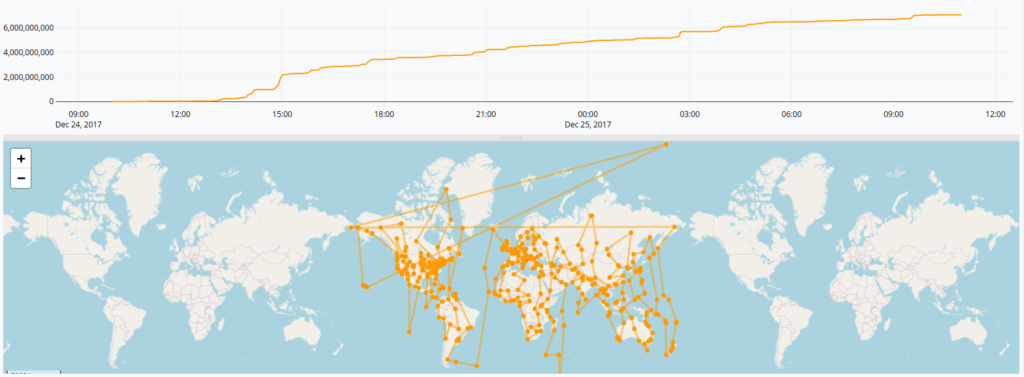
'https://sandbox.senx.io/api/v0/update'You can verify data with WarpStudio:
'<your READ token>' 'token' STORE
[ $token 'santa.tracker' {} NOW MINLONG ] FETCH
https://snapshot.senx.io/0005d229eb82c16c-0-1-36f75e8e7d976759
Discovery
Now, let's build the dashboard.
| Learn more about Discovery and how to build your own dynamic dashboard. |
The first step is to create a new file called index.html:
<html>
<head>
  <title>Santa tracker</title>
</head>
<body>
<discovery-dashboard url="https://sandbox.senx.io/api/v0/exec">
 {
    'title' 'Santa tracker'
    'tiles' []
}
</discovery-dashboard>
<script nomodule src="https://unpkg.com/@senx/discovery-widgets/dist/discovery/discovery.js"></script>
<script type="module" src="https://unpkg.com/@senx/discovery-widgets/dist/discovery/discovery.esm.js"></script>
</body>
</html>
For security purposes, you need to serve it with a real HTTP server to open it with your browser. For example:
$ npm install --global http-server
$ http-server .
And open http://127.0.0.1:8083
Dashboard Tiles
The first thing we want to do is to display the map with the Santa tracking.
 {
    'title' 'Santa tracker'
    'tiles' [
        {
            'type' 'map'
            'w' 12 'h' 4 'x' 0 'y' 0
            'macro' <%
            '<your READ token>' 'token' STORE
            [ $token 'santa.tracker' {} NOW MINLONG ] FETCH
            %>
        }
    ]
}
That's it.
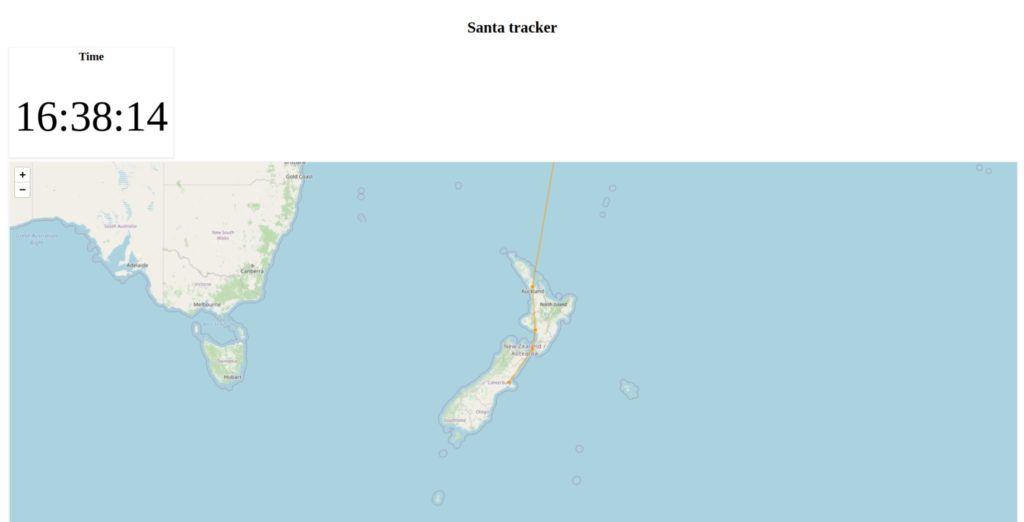
But, wait, what we want is to focus on children during Christmas Eve, so we need to show some animation.
The main idea is to have a timer tile which sends the current time with the event mechanism. Then the map tile will display the Santa track from the very first point till this date.
This dataset is 2018 one, so we have to cheat with the dates by time-shifting them. The second issue is that the Santa delivery process lasts 24 hours, so, it will be handy during the development process to scale down the global duration of the delivery.
| Read more about how to create a custom tile for Discovery. |
0.01 'scale' STORE
'<your READ token>' 'token' STORE
// Fetch the dataset
[ $token 'santa.tracker' {} NOW MINLONG ] FETCH
// scale down the trip duration
$scale TIMESCALE  'data' STORE
// Get the start date of the Santa's World tour
$data FIRSTTICK 'first' STORE
// Shift the dataset to make it start now
$data NOW $first - TIMESHIFT 'data' STORENow we pass the starting date and the dataset as a dashboard variable:
0.01 'scale' STORE
'<your READ token>' 'token' STORE
// Fetch the dataset
[ $token 'santa.tracker' {} NOW MINLONG ] FETCH
// scale down the trip duration
$scale TIMESCALE  'data' STORE
// Get the start date of the Santa's World tour
$data FIRSTTICK 'first' STORE
// Shift the dataset to make it start now
$data NOW $first - TIMESHIFT 'data' STORE
{
  'title' 'Santa tracker'
  'vars' {
    'start' NOW            // a variable called $start will be available in tile's macros
    'gts' $data WRAP  //
  }
  'tiles' [
    {
      'title' 'Time'
      'endpoint' 'wss://sandbox.senx.io/api/v0/mobius' // Uses WebSockets
      'options' { 'autoRefresh' 1000 'timeMode' 'custom' } // refresh each second
      'type' 'display'  'x' 0 'y' 0 'w' 2 'h' 1
      'macro' <%
        {
          'data' NOW 'now' STORE
          // extract hour, minutes and seconds
          $now 'Europe/Paris' ->TSELEMENTS [ 3 5 ] SUBLIST
          // Format it for display
          <% TOSTRING 'v' STORE <% $v SIZE 2 < %> <% '0' $v + %> <% $v %> IFTE %> F LMAP ':' JOIN
          // Emit an event with the new start time
          'events' [ { 'tags' [ 'start' ] 'type' 'variable' 'value' { 'start' $now }  } ] }
      %>
    }
    {
      'options' {  'eventHandler' 'type=variable,tag=start' } // Event Handler for the timer tile
      'type' 'map' 'w' 12 'h' 4 'x' 0 'y' 1
      'macro' <%
        $gts UNWRAP $start MINLONG TIMECLIP 0 GET  'g' STORE // Keep only data before '$start'
        // get the last known timestamp
        $g LASTTICK 'last' STORE
        // extract the last known position
        $g $last ATTICK [ 1 2 ] SUBLIST 'loc' STORE
        {
          'data' $g
          'globalParams' {
            'map' {  // Center the map on the last data point
              'startLat' $loc 0 GET
              'startLong' $loc 1 GET
              'startZoom' 5
              'track' true
            }
          }
       }
     %>
    }
  ]
}
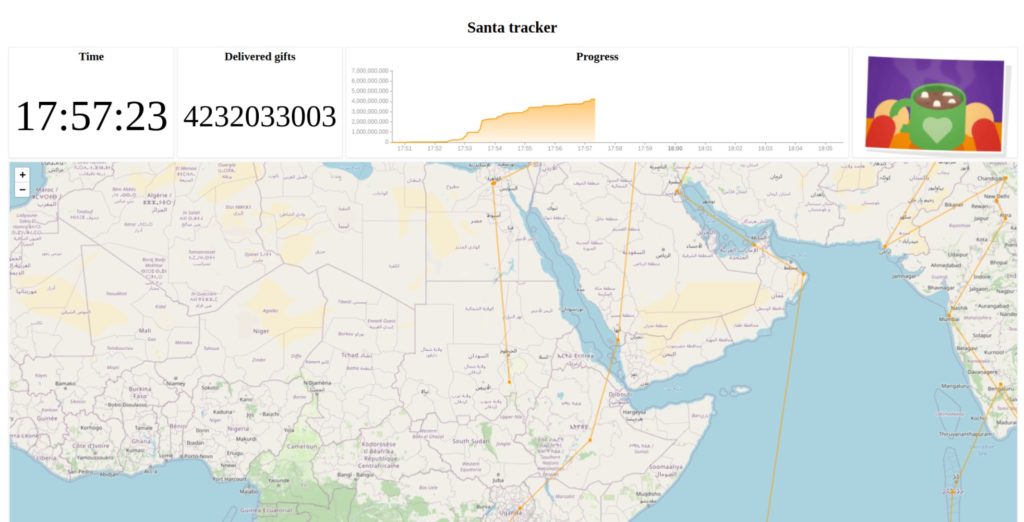
And then, add the number of delivered gifts:
 {
    'title' 'Delivered gifts'
    'options' { 'eventHandler' 'type=variable,tag=start' }
    'type' 'display' 'x' 2 'y' 0 'w' 2 'h' 1
    'macro' <%
      <%  // try
        // Keep only data before '$start'
        $gts UNWRAP $start MAXLONG TIMECLIP 0 GET
        // get the max (well the last value, Santa does no robbery )
        MAX TOSTRING
      %>
      // catch
      <% '0' %>
      // Finally
      <% %> TRY
    %>
  }
The delivery progress:
{
    'title' 'Progress'
    'options' { 'eventHandler' 'type=variable,tag=start' }
    'type' 'area' 'x' 4 'y' 0 'w' 6 'h' 1
    'macro' <%
      $gts UNWRAP 0 GET 'g' STORE
      {
        // Keep only data before '$start'
        'data' $g  $start MINLONG TIMECLIP
        // Fix x and y bounds for the chart
        'globalParams' {
          'bounds' {
            'maxDate' $g LASTTICK
            'minDate' $g FIRSTTICK
            'yRanges' [ 0 $g MAX ]
          }
       }
    }
  %>
}
Now, it could be fun to display the funny quotes and pictures stored in santa.stream, the latest one, of course, depending on the current time.
To do so, we have to add a new variable:
0.01 'scale' STORE
'<your READ token>' 'token' STORE
// Fetch both at a time with a RegExp
[ $token '~santa.(tracker|stream)' {} NOW MINLONG ] FETCH $scale TIMESCALE 'data' STORE
// filter both to keep the track
[ $data [] 'santa.tracker' filter.byclass ] FILTER 'tracker' STORE
// filter both to keep the stream
[ $data [] 'santa.stream' filter.byclass ] FILTER 'stream' STORE
$tracker FIRSTTICK 'first' STORE
$tracker NOW $first - TIMESHIFT 'tracker' STORE
$stream NOW $first - TIMESHIFT 'stream' STORE
{
  'title' 'Santa tracker'
  'vars' {
    'start' NOW                // a variable called $start will be available in tile's macros
    'gts' $tracker WRAP  // wrapped tracker data
    'stream' $stream WRAP  // wrapped stream data
  }
[...]
And here is the most difficult part: display a quote or a picture according to the last value of santa.stream relatively to $start.
{
  'options' { 'eventHandler' 'type=variable,tag=start' 'timeMode' 'custom' }
  'type' 'display' 'x' 10 'y' 0 'w' 2 'h' 1
  'macro' <%
    // prepare a result
    ' ' 'res' STORE
    <% // try
      // Keep only data before '$start'
      $stream UNWRAP $start MAXLONG TIMECLIP 0 GET
      // Retrieve a values array and reverse order
      VALUES REVERSE
      // get the first item (the most recent one)
      0 GET
      // decode the JSON structure
      JSON-> 'status' STORE
      // If this is a funny quote stored under a 'status' key, get it and store it into $res
      $status 'status' CONTAINSKEY <% $status 'status' GET 'res' STORE %> IFT
      // If this is a funny quote stored under a 'didyouknow' key, get it and store it into $res
      $status 'didyouknow' CONTAINSKEY <% $status 'didyouknow' GET 'res' STORE %> IFT
      // if this is a picture url stores under a 'imageUrl' key
      $status 'imageUrl' CONTAINSKEY <%
        // build an HTML <img> tag
        '<' 'img src="' +                    //  little hack to avoid the browser to interpret it
        $status 'imageUrl' GET +
        '" style="height:100%25;width:100%25;object-fit:contain">' +  // url encoded CSS
        // and store it into $res
        'res' STORE
      %> IFT
    %>
    <% /* catch */ %>
    <%
      // finally
      { 'data' $res 'globalParams' { 'timeMode' 'custom' } }
    %> TRY
  %>
}
Hey dear elves, please, pimp my dashboard
With Discovery, it is easy to add some swag.
Global CSS styles:
<html>

<head>
  <title>Santa Tracker</title>
  <style>
    @import url('https://fonts.googleapis.com/css2?family=Kaushan+Script&family=Roboto:wght@300&display=swap');

    body {
      padding: 0 200px;
      margin: 0;
      font-family: 'Roboto', sans-serif;
      font-size: 12px;
      line-height: 1.52;
      background: white url("https://images.unsplash.com/photo-1576919228236-a097c32a5cd4?ixlib=rb-1.2.1&ixid=MnwxMjA3fDB8MHxwaG90by1wYWdlfHx8fGVufDB8fHx8&auto=format&fit=crop&w=1470&q=80");
      background-size: cover;
      color: red;
    }

    * {
      box-sizing: border-box;
    }

    discovery-dashboard {
      color: transparent;
    }
  </style>
</head>

<body>
  <discovery-dashboard url="https://sandbox.senx.io/api/v0/exec">

[...]
Dashboard specific swag:
{
    'title' 'Santa tracker'
    'cellHeight' 120
    'options' {
      'scheme' 'ATLANTIS'
      'customStyles' {
        '.discovery-dashboard-main'
          <'
            --warp-view-chart-legend-color : #fff;
            --warp-view-font-color : #fff; --warp-view-chart-label-color : #fff;
            --warp-view-chart-grid-color : #fff;
          '>
          ' .discovery-dashboard-main h1' "font-family: 'Kaushan Script', cursive;font-size: 60px !important;"
          '.discovery-dashboard-tile, .discovery-tile' 'border-radius: 16px;overflow:hidden;'
      }
  }
[...]
And for each tile (except the map)
{ 'data' $res 'globalParams' { 'bgColor' '#DC143C' } }For the map, it is a bit more tricky:
{
  'data' $g
  'params' [
    { 'marker' 'sleigh' 'render' 'path' 'line' true 'color' '#DC143C' }
  ]
  'globalParams' {
    'bgColor' '#DC143C'
    'map' {  // Center the map on the last data point
      'startLat' $loc 0 GET
      'startLong' $loc 1 GET
      'startZoom' 5
      'track' true
    }
  }
}| Discover more dataviz tutorials with Warp 10 |
Going further
You can now change the scale factor, the time shift amount, colors, and background to fit your needs for Christmas Eve and cast it on your TV.
In the real world, you can use those technics for asset tracking with a real-time monitoring dashboard.
The entire SenX team and I wish you a Merry Christmas.
Ho Ho Ho!
More articles about Discovery:
- Server monitoring with Warp 10 and Telegraf
- Covid Tracker built with Warp 10 and Discovery
- Using Warp 10 as a map tile server for Discovery
Full Discovery documentation is available here.
Read more
Thinking in WarpScript - Multi-Value Support
Remote dashboards with Discovery Explorer
What's new in the Warp 10 Ecosystem

Senior Software Engineer