This tutorial will show you how to monitor a system, trigger alerts, send notifications when an alert occurs and display important metrics with a dynamic dashboard.
This blog post will show you how to handle alerts with Warp 10 by building a simple website uptime checker. It follows on from a previous article: Alerts are real time series.
The main idea is to use a runner to periodically check some URLs and store the HTTP status code and the response time.
If the status code is greater or equal to 400, we publish an alert.
Alerts will be notified using https://ntfy.sh/ for demo purposes and finally, we will build a Discovery dashboard.
Configuration
In order for these macros to operate properly, they need to have access to a write token and a read token. These tokens should be defined in your configuration under the following keys:
alerting-write-token@senx/alerting = YOUR_WRITE_TOKEN
alerting-read-token@senx/alerting = YOUR_READ_TOKEN
You also have to configure our HTTP extension.
warpscript.extension.http = io.warp10.script.ext.http.HttpWarpScriptExtension
// If set to true, HTTP requires the stack to be authenticated
#warpscript.http.authentication.required =
// If set, the capability <warpscript.http.capability> is checked to grant access to HTTP function
warpscript.http.capability = http
// Maximum number of HTTP calls, 1 by default, can be raised with capability http.requests
warpscript.http.maxrequests = 1000
// Maximum downloaded bytes by HTTP, 65536 by default, can be raised with capability http.size
warpscript.http.maxsize = 6553600000
// Maximum chunk size allowed when dowloading per chunk using HTTP, 65536 by default, can be raised with capability http.chunksize
#warpscript.http.maxchunksize =
// List of patterns to include/exclude for hosts, works the same way as webcall.host.patterns. Defaults to the value of webcall.host.patterns.
warpscript.http.host.patterns = .*
Macros
At first, we have to define some macros, especially one which contains our website's URLs.
Create a new one in /path/to/warp10/macros/senx/uptime/sites.mc2:
{
  'name' '@senx/uptime/sites'
  'desc'
  <'
 Return monitored websites
  '>
  'sig' [ [ [   ] [ 'sites:LIST<MAP>'  ] ] ] // Signature
  'params' {
    'sites' 'List of maps describing sites, with `url`, `name` and `group`'
  }
  'examples' [  ]
} 'info' STORE

<%
  !$info INFO
  SAVE 'context' STORE
  <%
    [
      { 'url' 'https://blog.senx.io/' 'name' 'blog' 'group' 'prod' }
      { 'url' 'https://warp10.io/' 'name' 'warp10.io' 'group' 'prod' }
    ]
  %>
  <% // catch any exception
    RETHROW
  %>
  <% // finally, restore the context
    $context RESTORE
  %> TRY
%>
'macro' STORE
$macro
This macro simply returns a list of URLs with some metadata.
We also define a utility macro which inserts data into a GTS, /path/to/warp10/macros/senx/uptime/utils/toGTS.mc2:
{
  'name' '@senx/uptime/utils/toGTS'
  'desc'
  <'
 Create a GTS
  '>
  'sig' [ [ [ 'className:STRING' 'siteConfig:MAP' 'time:LONG' 'value:ANY'  ] [ 'gts:GTS'  ] ] ] // Signature
  'params' {
    'className' 'Class name for the resulting GTS'
    'siteConfig' 'Site config for generated labels'
    'time' 'Timestamp'
    'value' 'Value to store'
  }
  'examples' [
    <'
'io.senx.site.uptime.status' { 'name' 'blog' 'group' 'prod' } NOW 200 @senx/uptime/utils/toGTS
    '>
  ]
} 'info' STORE
<%
  !$info INFO
  SAVE 'context' STORE
  <%
    [ 'cn' 'site' 'n' 'v' ] STORE
     NEWGTS $cn RENAME { 'group' $site 'group' GET 'name' $site 'name' GET } RELABEL $n NaN NaN NaN $v ADDVALUE
  %>
  <% // catch any exception
    RETHROW
  %>
  <% // finally, restore the context
    $context RESTORE
  %> TRY
%>
'macro' STORE
$macro| Read this article to learn more about macro mechanism with Warp 10. |
Runners
The first step is to define a runner in /path/to/warp10/warpscript/uptime/60000/check-sites.mc2:
@senx/uptime/sites <%
  'site' STORE
  <%
    NOW 'n' STORE
    'http' CHRONOSTART
    // Perform an HTTP HEAD request
    { 'url' $site 'url' GET 'method' 'HEAD'  } HTTP 'res' STORE
    $res 'status.code' GET 'status' STORE
  %>
  <%
    404 'status' STORE
  %>
  <%
    'http' CHRONOEND
    // Get the elapsed time, in nanoseconds
    CHRONOSTATS 'http' GET 'total_time' GET
    // and convert it to milliseconds
    TODOUBLE 1000.0 / 1000.0 / 'total_time' STORE
   // if status >= 400
    <% $status 400 >= %>
    <%
      // emit an alert
      {
        'name' $site 'name' GET
        'group' $site 'group' GET
      }
      @senx/alerting/trigger
    %> IFT
    // insert status and response time in their corresponding GTS
    [
      'io.senx.site.uptime.status'  $site   $n  $status     @senx/uptime/utils/toGTS
      'io.senx.site.uptime.time'    $site   $n  $total_time @senx/uptime/utils/toGTS
    ]
    "YOUR_WRITE_TOKEN" UPDATE
  %> TRY
%> FOREACH
This runner will be run each 60000 milliseconds and for each URL will perform a "HEAD" request. We use CHRONOSTART, CHRONOEND, and CHRONOSTATS to grab the response time in nanoseconds.
We store the response time and the HTTP status in GTS.
If the status >= 400, we trigger an alert with @senx/alerting/trigger.
This will create an entry in the series alert.events{name=warp10.io,group=prod} indicating a TRIGGER action was performed, and a true value will appear in series alert{name=warp10.io,group=prod}, both at the same current timestamp.
Then we need to monitor our alerts and send a notification if any occur. Create /path/to/warp10/warpscript/uptime/60000/notify.mc2:
{
'group' 'prod'
}
NOW
$runner.periodicity ms 2 *
// Twice the periodicity to avoid problems with delays in runner execution
@senx/alerting/fetch
[ SWAP [] 'alert' filter.byclass ] FILTER // Keep only alert triggers
{ '.app' NULL } RELABEL // Remove unnecessary label
<%
'g' STORE
{
'method' 'POST'
'url' 'https://ntfy.sh/senx_alerts'
'body' '[' $g LABELS 'group' GET + '] ' + $g LABELS 'name' GET + ' down!' +
} HTTP DROP
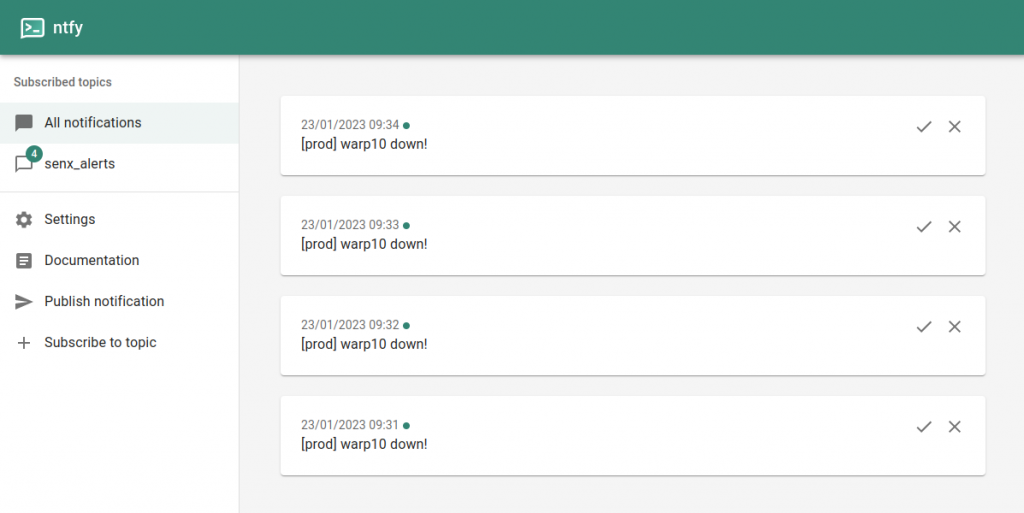
%> FOREACHYou can also publish your notification to Slack, Teams, AlertManager, or whatever.
Your alerting system is ready.
You can test it directly within the Ntfy web app by subscribing to the right topic.
| Read this article to learn more about runner mechanism with Warp 10. |
Discovery Dashboards
Now, we will show you how to build a complete Discovery dashboard that displays statuses, response time and alerts.
Bootstrapping
First, we have to define the dashboard skeleton, you can use either VSCode or WarpStudio.
// @endpoint https://your.warp10.instance/api/v0/exec
// @preview discovery     | a way to force the preview in VSCode
// @theme chalk              | global discovery theme, you can try 'default', 'light', 'dark', 'green', 'vintage' and some more

'YOUR_READ_TOKEN' 'token' STORE
{
  'title' 'Web Uptime'
  'vars' {
    // inject token into the dashboard
    'token' $token
    // an empty array for the statuses, this variable will be fed by the hidden tile
    'statuses' []
    // an empty array for the respTime, this variable will be fed by the hidden tile
    'respTime' []
    // the list of web sites names.
    'sites' @senx/uptime/sites
  }
  'options' {
    'showErrors' true    // displays WarpScript errors
    'scheme' 'CHALK'  // color scheme for charts
  }
  'tiles' [ /* tiles goes here */ ]
}
Data Tile
This tile is a hidden one. It will periodically perform a data fetch and dispatch the data to other tiles.
{
    // an hidden, zero sized tile
    'type' 'hidden' 'x' 0 'y' 0 'w' 0 'h' 0
    // Fetch data each 30 s
    'options' { 'autoRefresh' 30 }
    'macro' <%
      // A single fetch for response time and statuses
      [ $token '~io.senx.site.uptime.*' { 'name' '~' $sites <% 'name' GET %> F LMAP REOPTALT + } NOW 6 h ] FETCH
      'data' STORE
      // Extract response time
      [ $data [] 'io.senx.site.uptime.time' filter.byclass ] FILTER 'respTime' STORE
      // Extract statuses
      [ $data [] 'io.senx.site.uptime.status' filter.byclass ] FILTER 'statuses' STORE
        {
          'data' '' // We do not care of data in an hidden tile
          'events' [
            // Emits events with our GTSs
            { 'type' 'variable' 'tags' 'respTime' 'value' { 'respTime' $respTime WRAP } }
            { 'type' 'variable' 'tags' 'statuses' 'value' { 'statuses' $statuses WRAP } }
          ]
        }
    %>
  }
It is important to WRAP GTS (or list of GTSs) in order to propagate them through the event mechanism.
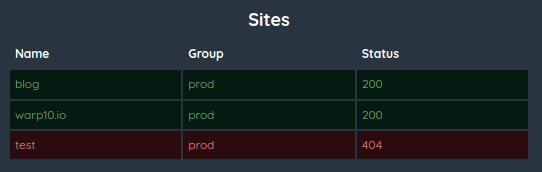
Status Tile
We will build an array tile that will sum up web sites status.
{
  // A tabular tile which fit the half width of the screen
  'type' 'tabular' 'x' 0 'y' 0 'w' 6 'h' 2
  'title' 'Sites'
  'options' {
    // listen at "statuses" events
    'eventHandler' 'type=variable,tag=statuses'
    'tabular' { 'fixedWidth' true }
  }
  'macro' <%
    // prepare the look and feel
    {} 'params' STORE
    // For each monitored web site
    $sites <%
      's' STORE
      // build a list ...
      [
        // with the web site name
        $s 'name' GET
        // with its group
        $s 'group' GET
        // UNWRAP statuses and get only the GTS which correspond to the current web site
        [ $statuses UNWRAP [] { 'name' $s 'name' GET } filter.bylabels ] FILTER
        // keep only the last value (it is a list of values)
        <% -1 SHRINK %> F LMAP VALUES FLATTEN 'value' STORE
        // If we have one
        <% $value SIZE 0 > %>
        <%
          // get it
          $value 0 GET 'v' STORE
          // the add custom row color depending of the value
          $params
          <% $v 400 >= %> // if status >= 400
          <% { 'bgColor' '#2C0B0E' 'fontColor' '#ea868f' } %> // red
          <% { 'bgColor' '#051B11' 'fontColor' '#75B26D' } %> // green
          IFTE
          // build a map with the web site name as key and our settings as value
          $s 'name' GET PUT 'params' STORE
          // add our value to the resulting array
          $v
        %>
        // If no value, add "na" to the resulting array
        <% 'na' %> IFTE
      ]
    %> F LMAP 'rows' STORE
    {
      // headers
      'columns' [ 'Name' 'Group' 'Status' ]
      // rows
      'rows' $rows
      // colors settings
      'params' $params
    }
  %>
}
Since we have wrapped our GTSs, it is important to UNWRAP them before using them.
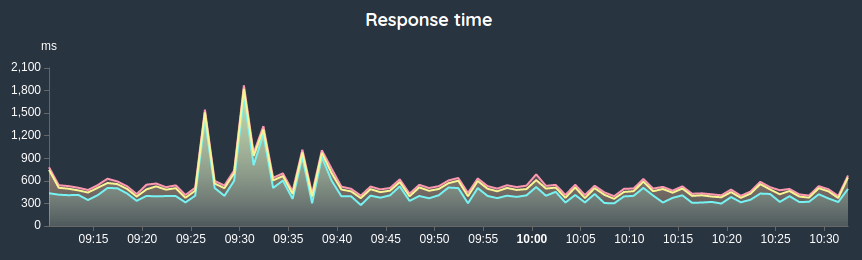
Response Time Tile
This tile will display a response time area chart.
{
  // An area chart
  'type' 'area'
  // fit the second half width of the screen
  'w' 6 'h' 2 'x' 6 'y' 0
  // listen at "respTime" events and has "ms" as unit.
  'options' { 'eventHandler' 'type=variable,tag=respTime' 'unit' 'ms' }
  'title' 'Response time'
  'macro' <%
    // unwrap our data
    $respTime UNWRAP
    // align ticks each minute (or whatever you want)
    [ SWAP bucketizer.last NOW 1 m 0 ] BUCKETIZE
    [ SWAP <%
      'd' STORE
      // We may have holes in a bucketized GTS, take caution of it
      <%
        $d 7 GET SIZE 0 >       // we need a value
        $d 7 GET 0 GET ISNULL ! // and a not null one
        &&
      %>
      <%
        // round it at 2 decimals
         $d 7 GET 0 GET TODOUBLE 100.0 * ROUND 100.0 / 'v' STORE
      %>
      <%
        // else
        NULL 'v' STORE
      %>
      IFTE
      // computes the new data point
      $d 0 GET NaN NaN NaN  $v
    %> MACROMAPPER 0 0 0 ] MAP 'data' STORE
    {
      'data' $data
      // rename each dataset with the web site name to be more human friendly
      'params' $data <% 'g' STORE { 'key' $g LABELS 'name' GET } %> F LMAP
    }
  %>
}
The Down Phases Chart
This chart is a kind of profile chart. We need to build a GTS which has a duration of an outage as a value.

{
// a profile chart
'type' 'profile'
// full width and below previous charts
'w' 12 'h' 2 'x' 0 'y' 2
'options' {
// Fetch data each 30 s
'autoRefresh' 30
'expandAnnotation' true
'displayExpander' false
}
'title' 'Down periods'
'macro' <%
// fetch alerts
[ $token 'alert' { 'name' '~' $sites <% 'name' GET %> F LMAP REOPTALT + } NOW 6 h ] FETCH
10 m // Consider 10 minutes quiet periods
2 // Consider blocks with at least 2 values
'occ' // Add a label 'occ' with the sequence number of each block
TIMESPLIT FLATTEN
// Keep only first and last tick
RANGECOMPACT
// Convert GTS to one which handle the duration between the first and the last tick
[ SWAP <%
'd' STORE
// Extract timestamps
$d 3 GET 'ts' STORE
// If 2 timestamps are available
<% $ts SIZE 1 > %>
// last - first
<% $ts 1 GET $ts 0 GET - %>
// else, we do not care
<% NULL %>
IFTE 'v' STORE
// compute a new data point with the duration as value
// and the first occurrence of the alert as timestamp
$d 3 GET 0 GET NaN NaN NaN $v
%> MACROMAPPER 0 1 0 ] MAP
// Group by site name
[ 'name' ] PARTITION VALUELIST
// and Merge by site name
<% MERGE %> F LMAP 'data' STORE
{
'data' $data
// rename each dataset with the web site name to be more human friendly
'params' $data <% 'g' STORE { 'key' $g LABELS 'name' GET } %> F LMAP
}
%>
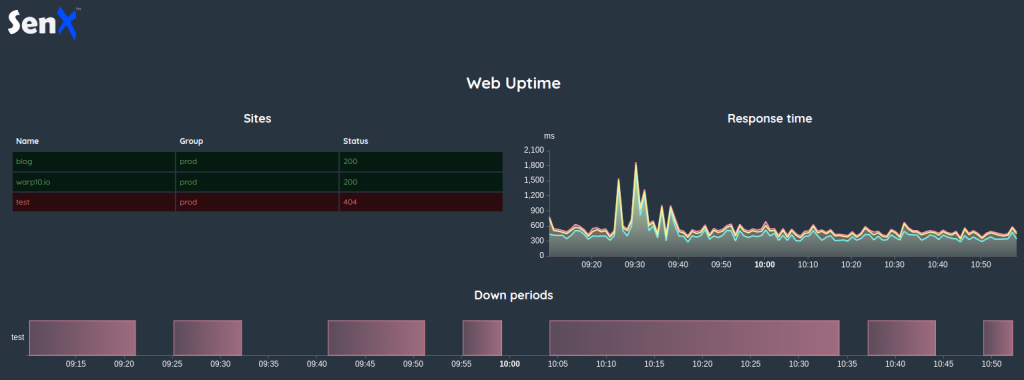
}All together
Here is the final result.
Going further
Of course, you can add more metrics or build a dashboard with a group or website selector.
You can also display some metrics related to SLA, send extra notifications when your website is down for too long, and so on.
You may also use Discovery Explorer to serve dashboards to your team.
As you have seen, managing alerts and external notifications is very easy.
Read more
What's new in the Warp 10 Ecosystem
Server monitoring with Warp 10 and Telegraf
WarpScript in Jupyter notebooks

Senior Software Engineer