Alerting is part of every monitoring solution, but have you ever looked at alerts as time series? By doing so an ocean of opportunities opens.
If you have ever set up a system for monitoring another system, you know comes a time when you can no longer stare at dashboards to ensure your system is behaving properly. That time is when you need to set up alerting, so you can wake up your teammates in the middle of the night.
Alerts come in different shapes, colors, and sizes. At SenX we strongly believe alerts are nothing more than time series with a notification mechanism to alter your sleep pattern. This post will walk you through alerts as we implement them on top of Warp 10 to provide notifications about anomalies on industrial equipment or on IT infrastructure.
Alerts as Time Series
When you see the world as time series as we do, alerts appear as simple series of boolean values, with true meaning that the alerting condition is met and false or the absence of value that it is not. The meaning and complexity of the underlying condition are very flexible. It could be a simple threshold that is passed, a diversion from a previous trend, a detected anomaly, or any other thing you might think of.
Treating alerts as time series means to periodically assess those conditions and, depending on the outcome, to insert boolean values in a set of time series. Those series will accrue values and give you a very good understanding of your systems.
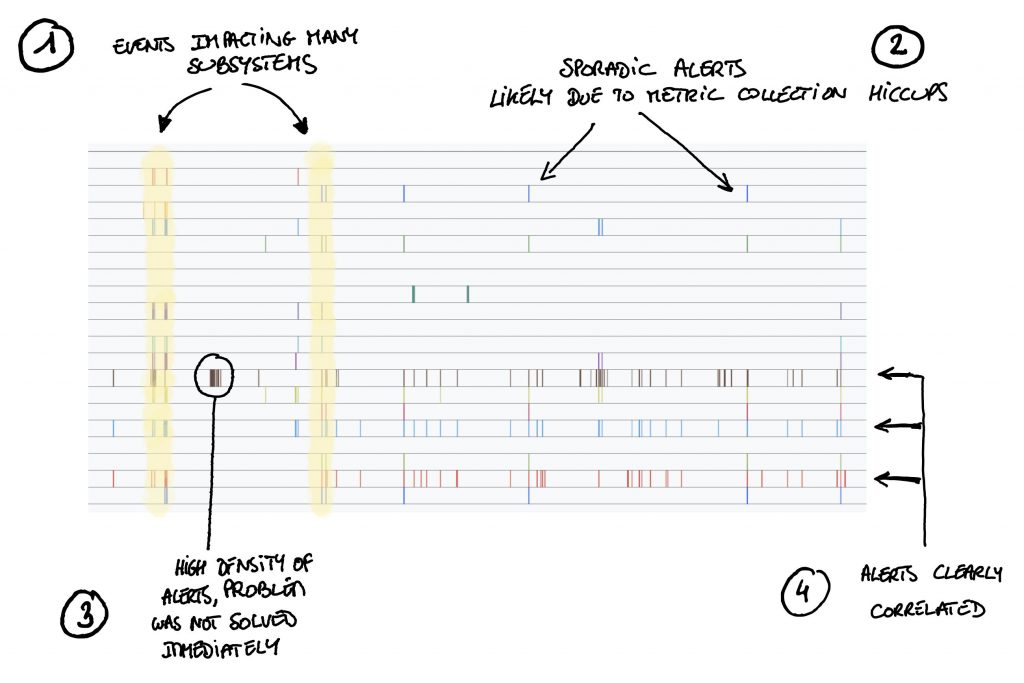
The example above shows alert series related to a subsystem of a complex infrastructure over a period of several months.
By just looking at those series you can see some very interesting things:
At (1) you can see that many alerts are triggered at the same time. This means that some events impacted multiple systems, in the present case, network outages which caused several services to fail.
Then at (2) we see sporadic alerts, single values here and there, meaning that a condition was evaluated to true in an isolated manner. Most of the time these lonely alerts are due to metrics which arrive late and therefore lead to a condition evaluation based on data which does not reflect reality. If this type of alerts repeats itself too often it might be time to tune your metric collection system.
At (3) we see a high density of alerts, this happens when the root cause of the alerts is not dealt with rapidly, the condition keeps on evaluate to true and therefore values keep being added to the alert time series. If you see too many of those you might need to talk to your on-call team. They are not acting fast enough or the issues they faces were complex to resolve.
Finally, at (4), you see three alerts which are triggered almost always at the same time, this either means that some of them are not useful or that a component has an impact on several, a little like in case (1).
Another benefit of treating alerts as time series is that you can easily test out new alerting conditions by running the condition on past metrics values and see how often alerts would be triggered. You could then assess if the new condition would have generated more or less alerts than the current one, and you could see if known incidents could have been detected earlier or not.
You see, by treating alerts as time series you can learn a lot about the systems you supervise, and believe it or not, no notification was involved.
Alerts and notifications are two different beasts
This is probably not what you thought up to now, but once you think about alerts as time series, notifications are simply here to warn you about the current situation, they are not the alerts themselves. So it is very important that when you design your supervision stack you clearly separate the notification step from the condition assessments which will lead to values in the alert time series.
If notifications and alert conditions are too much entangled, you will have a hard time setting up efficient alerts. You will reason about the messenger (the email, page, or phone call you receive in the middle of the night) and not about the message itself.
Notifications should have a flexibility of their own, meaning that different target groups should decide to receive notifications, based on differing interpretations of the alert time series. Some teams might want to get paged when alerts outside their direct concern become too dense because they might indicate a worsening situation which may need their intervention, and ultimately may require they add new alerts themselves.
Alerts in Warp 10
We have been using Warp 10 for alerting for a long time. As a matter of fact, we monitor our own WarpCloud hosted platform using other instances of Warp 10. And alerting and notifications are entirely handled in WarpScript.
So we will focus in the rest of this article on the alerting part done in Warp 10.
For notifications, we will cover how to leverage external tools. The notification mechanisms available in Warp 10 itself will be covered in another post.
Configuration
Over the years we have crafted macros which help us create and manage alerts. Those macros are now Open Source (AGPL) and available on SenX' WarpFleet repository. This repository is configured by default in fresh Warp 10 installs so you most probably won't have to add it.
In order for these macros to operate properly, they need to have access to a write and a read token. Those tokens should be defined in your configuration under the following keys:
alerting-write-token@senx/alerting = YOUR_WRITE_TOKEN
alerting-read-token@senx/alerting = YOUR_READ_TOKEN
Once those configs have been added, restart your Warp 10 instance. It will then be ready to use the alerting macros, and you can run the examples which appear in the rest of this post.
How are alerts stored?
The alerting macros will use the tokens provided in the configuration to store and read Geo Time Series (GTS) containing the alerts.
They manage two sets of GTS, the first one is alerts GTS which use alert as their class name. These series contain boolean values, actually, mainly true values, indicating whether an alert condition is met or not. The second set of series contains events series which keep track of the actions performed by the alerting macros. These series use the alert.events class name. Both sets of series use labels to identify alerts.
Those labels should contain elements which add context about the systems subject of the alerts (device id, rack, engine number, data center, …) but not to the actual alert beyond its name.
For example, if you are triggering an alert because the equipment is experiencing extreme vibrations, you should not include the precise level of vibration in the labels. There are some macros to add that type of context to an alert.
Triggering an alert
You collect data points in various series which represent the state of systems you supervise, whether industrial or IT. Periodically you run macros which perform computations on those series to check various conditions. When a specific condition is met, you want to trigger an alert named cond.1 to record this fact.
In your script, you would call the macro @senx/alerting/trigger with a map containing the labels you want to attach to the alert. Remember, those labels will end up as the labels of the series tracking the condition.
In the following example, we set three labels, name with the name of the alert, equipment with the id of the equipment experiencing this condition and factory with the reference of the factory where the equipment is located. These latter two information were probably retrieved from the labels of the series on which the computation was performed. The code to trigger the alert would then be:
{
  'name' 'cond.1'
  'factory' 'factory.A'
  'equipment' '12B27-3'
}
@senx/alerting/trigger
That is all there is to it. This will create an entry in the series alert.events{name=cond.1,factory=factory.A,equipment=12B27-3} indicating a TRIGGER action was performed, and a true value will appear in series alert{name=cond.1,factory=factory.A,equipment=12B27-3}, both at the same current timestamp.
Retrieving alerts
The alerts created via @senx/alerting/trigger can be retrieved either via a regular FETCH call with the appropriate token or more directly via the macro @senx/alerting/fetch. This macro expects a map of labels, an end timestamp, and a duration.
To retrieve all alerts related to factory.A during the last 24 hours simply execute the following:
{
  'factory' 'factory.A'
}
NOW
24 h
@senx/alerting/fetch
This will retrieve the data points of the last 24 hours for both the alert and alert.events series with label factory set to factory.A.
Splitting alerts
When alerts are triggered, it is rare that only a single value gets written to the alert series. Usually, the condition triggering the alert is met during several consecutive time intervals at which it is computed.
This leads to blocks of true values in the alert Geo Time Series, each block can be considered a separate occurrence of the actual alert, and it is therefore, useful to be able to isolate each of those occurrences.
This is done quite easily in WarpScript using the TIMESPLIT function which will split a GTS in multiple sub GTS based on quiet periods where no values exist in the GTS. So for example, if you consider that blocks of values separated by more than 30 minutes are separate occurrences of the alert, you can use the following WarpScript code to isolate each occurrence:
// We consider 'alert' series to be in variable $alerts
$alerts
30 m   // Consider 30 minute quiet periods
2      // Consider blocks with at least 2 values
'occ'  // Add a label 'occ' with the sequence number of each block
TIMESPLIT
The result will be a list of lists, one for each alert, containing one Geo Time Series per occurrence of each alert.
Those isolated occurrences, especially the most recent one, can then be used for further processing such as notifying your on-call team.
Notifications
There are multiple ways of handling the notification of alerts stored in Warp 10. You could do that entirely with the Warp 10 ecosystem, using Discovery for instance. But it would require a fair amount of development. Instead, in this post, we will rely on Prometheus' Alertmanager to handle the notifications to simplify the set-up.
Setting up Alertmanager
First download Alertmanager and create a very simple configuration file simplealertmanager.yml:
global:
  resolve_timeout: 5m
  slack_api_url: "https://hooks.slack.com/services/XXXXXXXXX/XXXXXXXXX/XXXXXXXXXXXXXXXXXXXXXXXX"
route:
  group_by: ["factory" , "equipment"]
  receiver: "slack.alerts"
receivers:
- name: "slack.alerts"
  slack_configs:
    - channel: "#alerts"
This file tells Alertmanager to send all alerts to the #alerts channel through a Slack hook and to group alerts by factory and equipment. After setting your Slack hook, you can start Alertmanager with ./alertmanager --config.file=simplealertmanager.yml.
Send alerts to Alertmanager
Now, we have to set up a Warp 10 runner, a script running with a defined periodicity, to fetch the current alerts and forward them to the Alertmanager. The idea is quite simple: get the last alerts every 60000 ms (1 minute) and send them through the alerts API. To do that, create a forward.mc2 file in WARP10_HOME/warpscripts/alertmanager/60000/ with the following content:
// Fetch ALL alerts
{}
NOW
$runner.periodicity ms 2 *
// Twice the periodicity to avoid problems with delays in runner execution
@senx/alerting/fetch
[ SWAP [] 'alert' filter.byclass ] FILTER // Keep only alert triggers
{ '.app' NULL } RELABEL // Remove unnecessary label
'alerts_lgts' STORE
$alerts_lgts SIZE 0 > // If there are alerts.
<%
  'A_WRITE_TOKEN' // A write token, just to allow the use of WEBCALL.
  'POST'          // POST the body
  'http://localhost:9093/api/v2/alerts' // Your local Alertmanager.
  { 'Content-Type' 'application/json' } // Tell that data is JSON.
  // Convert the list of GTS to a list of alerts for Alertmanager
  $alerts_lgts
  <%
    'alerts_gts' STORE
    $alerts_gts TICKLIST
    <%
      'alerts_timestamp' STORE
      {
        'labels' $alerts_gts LABELS
        'startsAt' $alerts_timestamp ISO8601
      }
    %>
    F LMAP
  %>
  F LFLATMAP
  ->JSON
  WEBCALL
%>
IFT
That's it!
Whenever you trigger an alert with @senx/alerting/trigger, the alert will be forwarded to Alertmanager by the runner and then the Alertmanager will notify you on the #alerts Slack channel. You can also browse the active alerts on http://localhost:9093.
Grouping
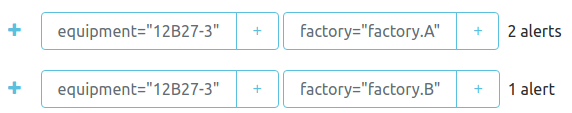
As we grouped the alerts by factory and equipment in the configuration file, if we trigger several alerts for the same factory+equipment, they will appear together in the UI. This is very handy to avoid alert storms as they will also trigger a single notification for the group. Look for instance:
{
  'name' 'cond.1'
  'factory' 'factory.A'
  'equipment' '12B27-3'
} @senx/alerting/trigger

{
  'name' 'cond.2'
  'factory' 'factory.A'
  'equipment' '12B27-3'
} @senx/alerting/trigger

{
  'name' 'cond.1'       // Same condition
  'factory' 'factory.B' // Other factory
  'equipment' '12B27-3' // Same equipment name
} @senx/alerting/trigger
Will result in the following in the UI:
Takeaways
You should think of alerts as simple time series of abnormal events. This allows you to look back at alerts and gain insight on how your system fails and the different patterns in alerts. This, in turn, helps you build an even better alerting system by knowing if alerts fire too often, or are always correlated to others for instance.
You should also think of notifications of alerts as a separate component whose role is only to look into active alerts and define a strategy on how to notify the best team for the issue.
Read more
Data replication with Warp 10
WarpFleet Gradle Plugin
Demystifying LevelDB

WarpScript™ Doctor