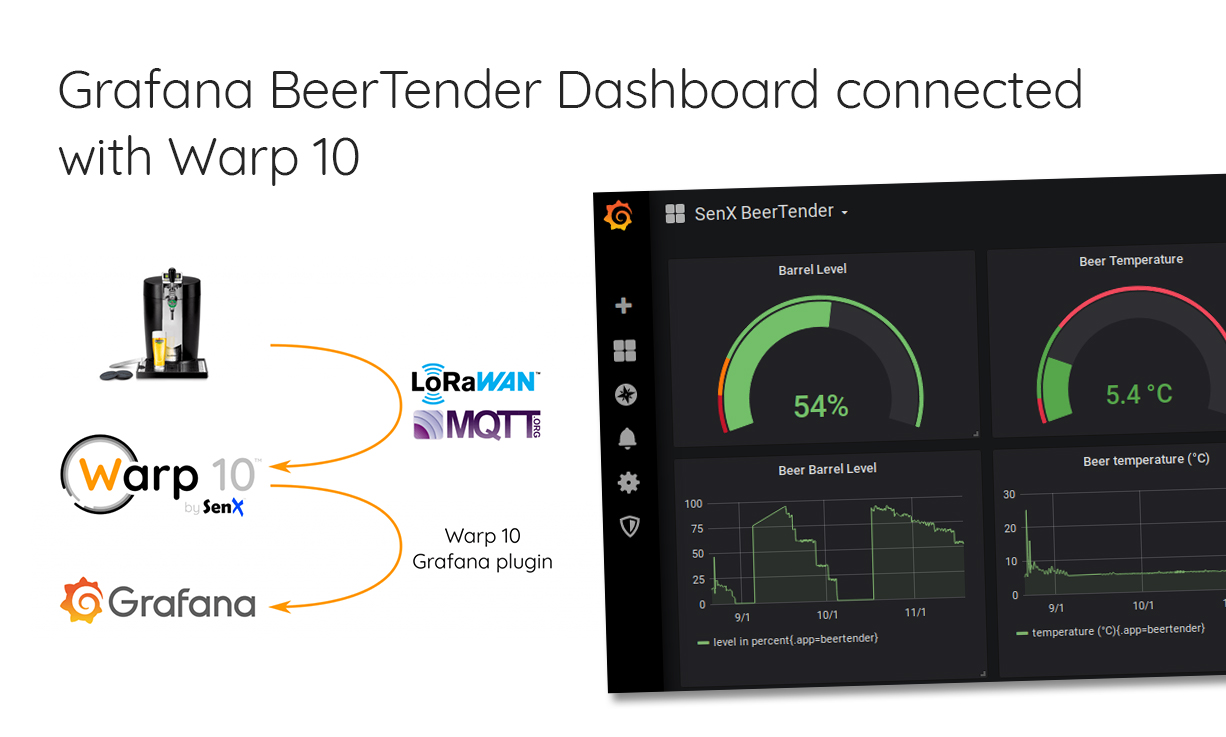
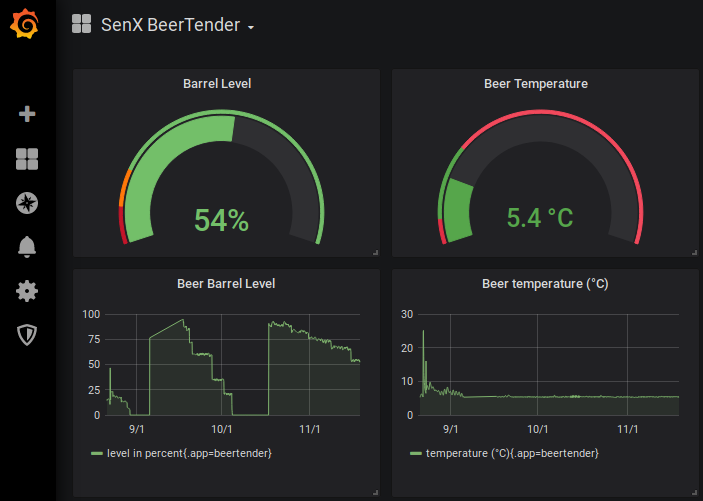
Thanks to a dedicated data source, it is really easy to connect Warp 10 to Grafana. Learn how to build a BeerTender Dashboard!
OVHcloud, the biggest European hosting and cloud provider, is a Warp 10 power user. They gather all their monitoring data in one Warp 10 cluster. 400k servers, 27 datacenters, just a few million data points per second!
They use lots of dashboards and are now the maintainer of the open-source Warp 10 Grafana plugin we started a while back. I am going to introduce this plugin for new users. If you want to test it on your side, the data source is public, you can copy all the WarpScript below.
Install
First, install Grafana. Follow instructions on their website.
Connect to the default URL, http://localhost:3000/, use the default admin/admin password to log in, then change the admin password.
You now need to install the Warp 10 data source plugin. You can do it easily with grafana-cli plugins install ovh-warp10-datasource.
It can also be done manually: you just need to clone the plugin repo into the Grafana plugin directory and fix permissions everywhere.
sudo systemctl stop grafana-server.service
sudo chown -R grafana:mygroup /var/lib/grafana/
sudo chmod g+rw /var/lib/grafana/plugins
git clone git@github.com:ovh/ovh-warp10-datasource.git /var/lib/grafana/plugins/ovh-warp10-datasource
sudo chown -R grafana:mygroup /var/lib/grafana/plugins
sudo systemctl start grafana-server.service
Configure
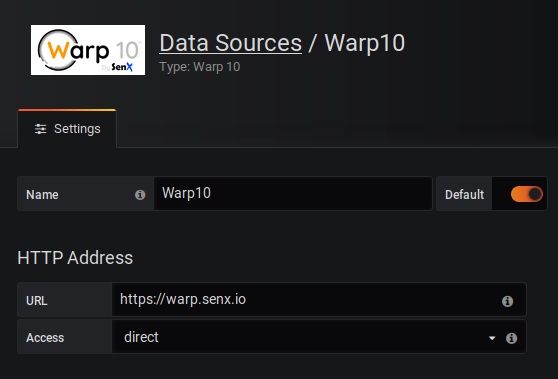
In the Grafana configuration, select data sources, and add a Warp 10 data source. Make sure it points to the Warp 10 instance you want. You can use the same as below for your tests:
It is time to access the BeerTender raw sensor data…
Display temperature raw sensor data
Create a new dashboard, with a graph, and edit the data source:
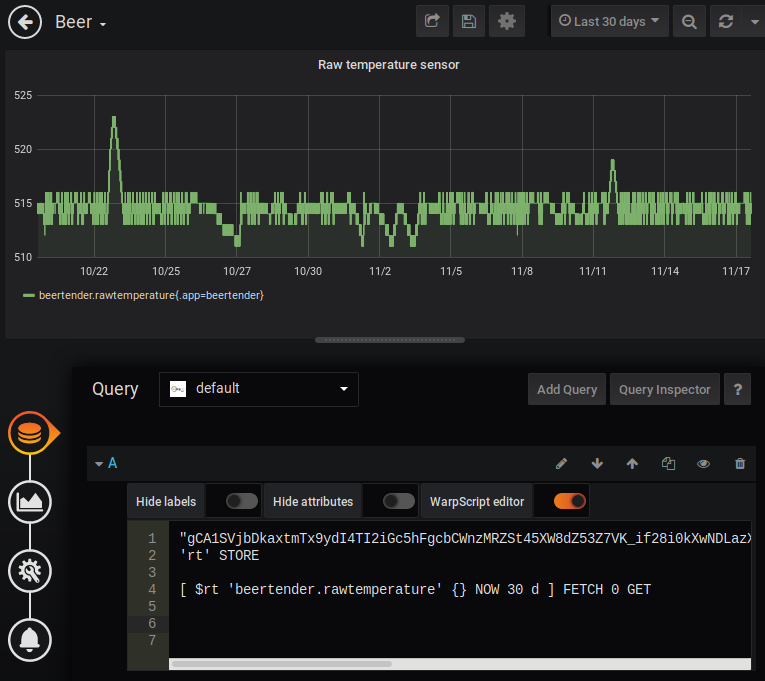
- In the data source, select Warp 10 (or default)
- Turn on the WarpScript editor
- Copy the following WarpScript
- Select "Last 30 days" in the upper right corner
- Save the result
'gCA1SVjbDkaxtmTx9ydI4TI2iGc5hFgcbCWnzMRZSt45XW8dZ53Z7VK_if28i0kXwNDLazXHgLrXUKgxLK0RbS79eJmBCpyBlIxw9US7bPfdWH4Fta51.kXN.D4Hsk5OZOwl.vLRBzMpP7F2pAMfclMXSGtCOT6F'
'rt' STORE
[ $rt 'beertender.rawtemperature' {} NOW 30 d ] FETCH
0 GET
It will display the raw value from the ADC. Note that the WarpScript editor in Grafana is not as powerful as it used to be, there is no more completion. You can use WarpStudio or VSCode to write the WarpScript, then copy-paste the result in Grafana to benefit from syntax highlighting and online documentation.
Automatic Time Span
In this example, I choose a 30 days interval, and I set Grafana history to 30 days. If I select a one day or one-year history in Grafana, my WarpScript will always fetch 30 days. The plugin provides a nice way to solve this issue: before sending the WarpScript, it defines two variables you can use in your WarpScript: $end and $interval.
[ $rt 'beertender.rawtemperature' {} $end $interval ] FETCH 0 GET Beer Temperature
I did a few measures with a reference sensor, water, ice, hot water… The interpolation table is:
| T (°C) | raw value |
| 18,3 | 680 |
| 41,5 | 870 |
| 37,6 | 841 |
| 10 | 586 |
| 11 | 596 |
| 8 | 559 |
| 1 | 467 |
| 4,5 | 500 |
| 6,5 | 535 |
NEWGTS 'linearInterpolation' RENAME
680 NaN NaN NaN 18.3 ADDVALUE
870 NaN NaN NaN 41.5 ADDVALUE
841 NaN NaN NaN 37.6 ADDVALUE
586 NaN NaN NaN 10 ADDVALUE
596 NaN NaN NaN 11 ADDVALUE
559 NaN NaN NaN 8 ADDVALUE
467 NaN NaN NaN 1 ADDVALUE
500 NaN NaN NaN 4.5 ADDVALUE
535 NaN NaN NaN 6.5 ADDVALUE
SORT
If I put these values in a GTS, with tick = raw value, then sort the result:
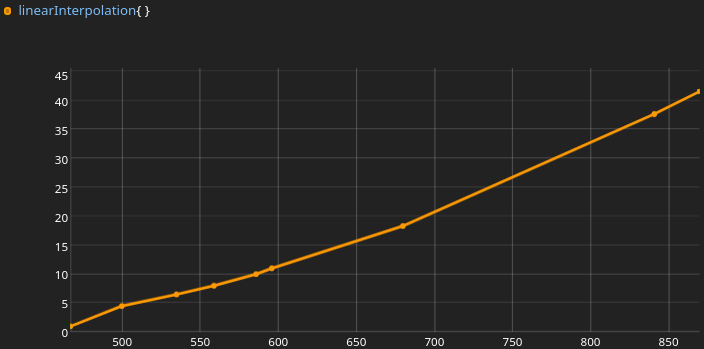
The raw result is always an integer. The simplest way to do the interpolation is to interpolate the curve, then use ATTICK function to read the value in degrees from the raw value.
Interpolation is easy in WarpScript
You have to bucketize the GTS to set the period you want, then call interpolate to fill the missing values.
[ $linearInterpolation bucketizer.last 0 1 0 ] BUCKETIZE 0 GET
INTERPOLATE
SORT 'truthtableGTS' STORE
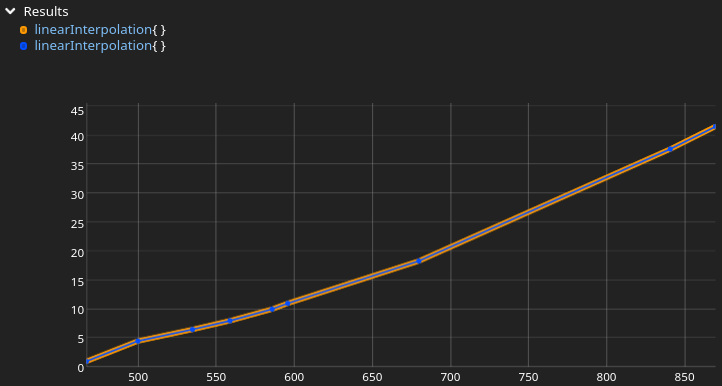
Perfect. I now need to write a custom mapper to replace every raw value by the real physical one, and let the result on the stack for Grafana to display it.
Warning: there is one value every 10s. For 3 months, it means 270K values. A little too much for Grafana… I will just keep the maximum value of each hour. In WarpScript, this is a BUCKETIZE with bucketizer.max bucketizer.
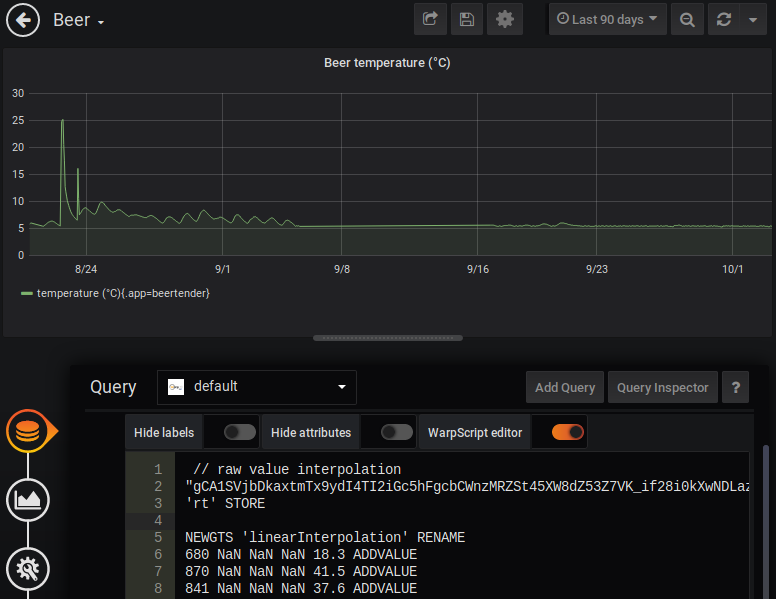
You can copy this WarpScript into Grafana:
// raw value interpolation
'gCA1SVjbDkaxtmTx9ydI4TI2iGc5hFgcbCWnzMRZSt45XW8dZ53Z7VK_if28i0kXwNDLazXHgLrXUKgxLK0RbS79eJmBCpyBlIxw9US7bPfdWH4Fta51.kXN.D4Hsk5OZOwl.vLRBzMpP7F2pAMfclMXSGtCOT6F'
'rt' STORE

NEWGTS 'linearInterpolation' RENAME
680 NaN NaN NaN 18.3 ADDVALUE
870 NaN NaN NaN 41.5 ADDVALUE
841 NaN NaN NaN 37.6 ADDVALUE
586 NaN NaN NaN 10 ADDVALUE
596 NaN NaN NaN 11 ADDVALUE
559 NaN NaN NaN 8 ADDVALUE
467 NaN NaN NaN 1 ADDVALUE
500 NaN NaN NaN 4.5 ADDVALUE
535 NaN NaN NaN 6.5 ADDVALUE
SORT 'linearInterpolation' STORE

[ $linearInterpolation bucketizer.last 0 1 0 ] BUCKETIZE 0 GET
INTERPOLATE 'truthtableGTS' STORE
[ $rt 'beertender.rawtemperature' {} $end $interval ] FETCH

// subsampling, keep max of every hour
[ SWAP bucketizer.max 0 1 h 0 ] BUCKETIZE
UNBUCKETIZE

// do not try to interpolate missing buckets.
// interpolation
[ SWAP
  <%
    'l' STORE
    [
      $l 0 GET //same tick
      NaN NaN NaN  //no latitude/longitude/elevation
      $truthtableGTS $l 7 GET 0 GET ATTICK 4 GET //take the interpolated value
    ]
  %> MACROMAPPER
  0 0 0 ] MAP
'temperature (°C)' RENAME
Beer barrel level
The barrel level sensor is a strain gauge… But a cheap three wire one, mounted on a rusted metal support. There is no way to be precise with this kind of hardware. So, no surprise, the raw output is really noisy, and the absolute value cannot be trusted. I found an experimental formula for my BeerTender, and I want to display the current level in percent in Grafana.
Tip: the Warp 10 plugin expects GTS, nothing else. Even if you want to display a single value, it must be wrapped in a one-point GTS.
Here is the WarpScript that take the last data point, and turn it into a percentage, and create a one point GTS:
'gCA1SVjbDkaxtmTx9ydI4TI2iGc5hFgcbCWnzMRZSt45XW8dZ53Z7VK_if28i0kXwNDLazXHgLrXUKgxLK0RbS79eJmBCpyBlIxw9US7bPfdWH4Fta51.kXN.D4Hsk5OZOwl.vLRBzMpP7F2pAMfclMXSGtCOT6F' 'rt' STORE

//read for beer level
[ $rt 'beertender.rawvalue' {} NOW -1 ] FETCH
0 GET VALUES 0 GET 'rawSensorValue' STORE
//raw correction:
// empty: 30.8e6
// full (and cold): 30.5e6
30.8e6 $rawSensorValue - 0 MAX 2800 / 100 MIN   'beerlevelPercent' STORE
$beerlevelPercent
NEWGTS 'Barre Level (%25)' RENAME
1 NaN NaN NaN $beerlevelPercent ADDVALUE
You can copy this WarpScript as the data source of a gauge:
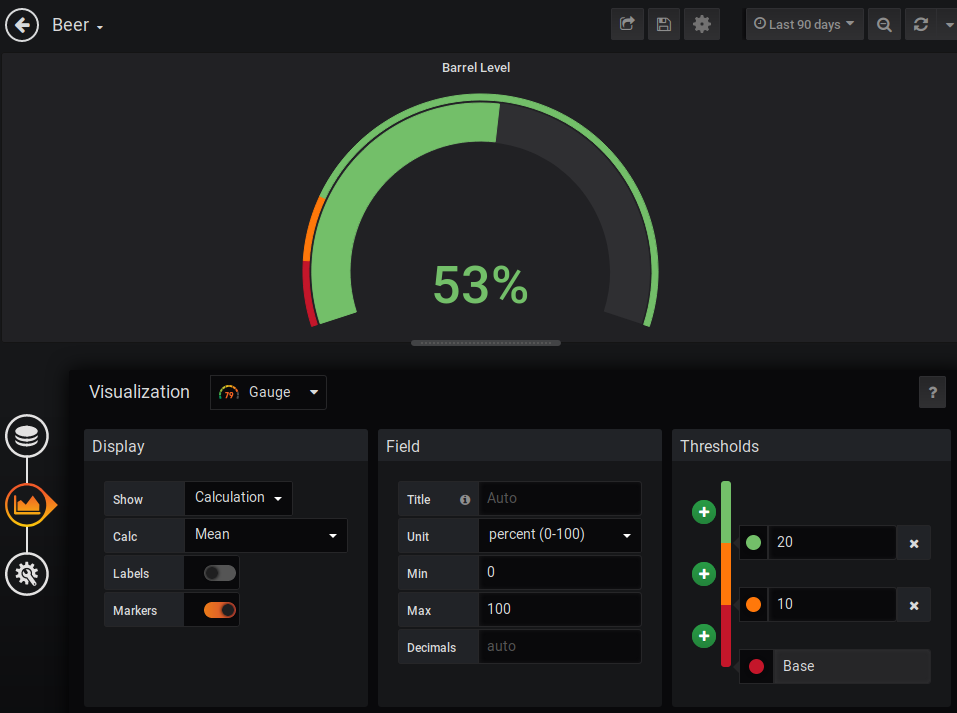
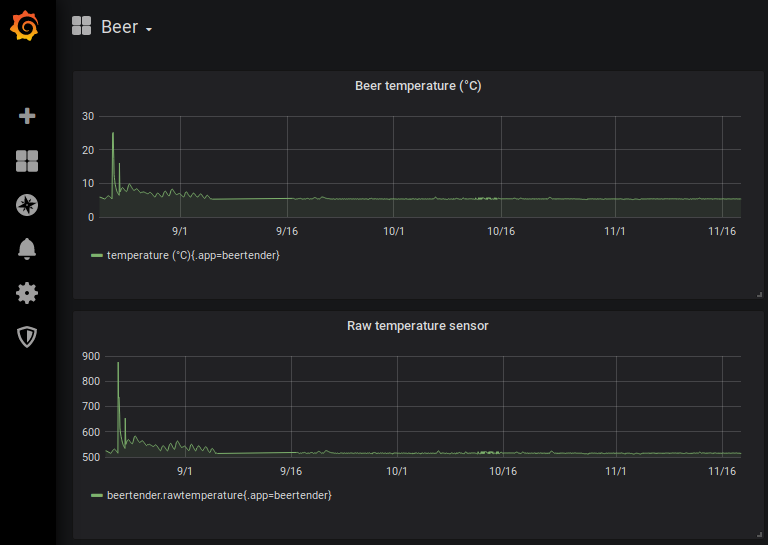
If you are curious, you can look at the raw signal… You now have the token to access this unique beer consumption dataset!
Takeaways
- As long as you manipulate monitoring data (not far in the past, not in the future), Grafana can easily integrate the Warp 10 data source.
- Grafana plugin expects GTS or a list of GTS.
- OVHcloud is the current maintainer of the plugin. Feel free to contribute!
- Read the doc for more information.
- If you want more possibilities for your dataviz, you can use our off-the-shelf web components.

Read more
Captain's Log, Stardate 4353.3
Edge computing: Build your own IoT Platform
2022 review of the Warp 10 platform

Electronics engineer, fond of computer science, embedded solution developer.