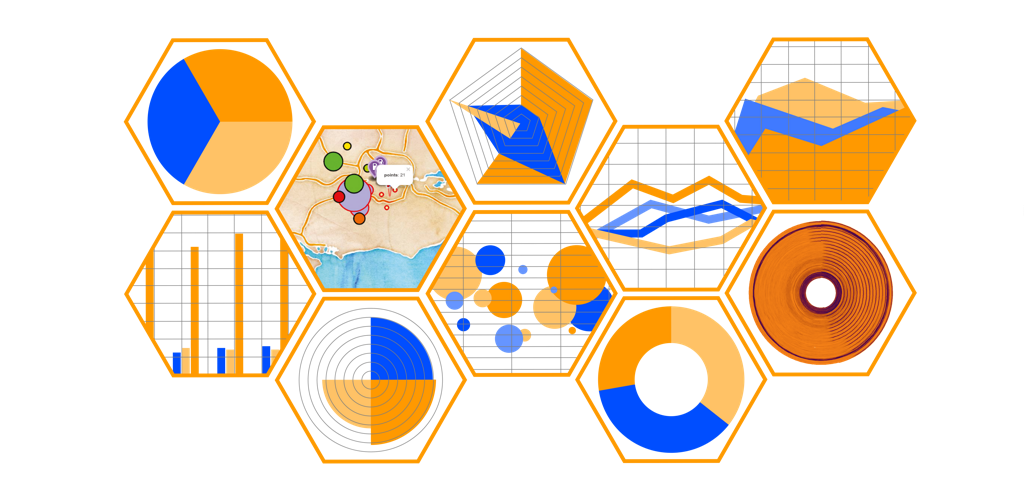
Introduction to WarpView, a collection of charting web components dedicated to Warp 10™ dataviz.

WarpView is a collection of charting web components dedicated to Warp 10. It affords you a way to build easily beautiful dashboards without too much code. An HTML knowledge is enough.
Web Components
A Web Component could be considered as an extension of the HTML vocabulary. It provides an efficient way to use "Widgets" for your website.
You can use them to construct custom dashboards, whatever the JavaScript framework you use (React, Angular, Vue, jQuery, …). It is designed to be integrated seamlessly with your technologies.
WarpView is used by our VSCode plugin.
Installation
npm i @senx/warpview --save
#or
yarn add @senx/warpview
#or
<script src="https://unpkg.com/@senx/warpview@1.0.33/dist/warpview.js"></script>
<html>
<head>
<title>Test</title>
<script src="node_modules/@senx/warpview/dist/warpview.js"></script>
</head>
<body>
<warp-view-spinner />
</body>
</html>Sample usage
WarpViewTile
This component aims to display a chart built with Warp 10 data. You have to provide a WarpScript and the Warp 10 endpoint. WarpViewTile will send an Ajax request against Warp 10 and display the result. You can even choose the kind of graph.
| Drawing server side can easily be done in WarpScript in your Warp 10 database. |
This is the easiest way to display a WarpScript result:
<warp-view-tile
  url="warp 10 url"
  responsive="true|false"
  unit="your unit"
  chart-title="your title"
  type="line|scatter|step|area|bubble|pie|gauge|doughnut|polar|radar|bar|text|image|plot">

  <!-- WarpScript goes here-->

</warp-view-tile>
For example:
<div style="height: 400px; width:100%">
  <warp-view-tile url="https://warp.senx.io/api/v0/exec" responsive="true" type="line">
    [
      NEWGTS
      0 50
      <%
        'i' STORE
        NOW $i -1 * ADDDAYS NaN NaN NaN RAND 10 * ADDVALUE
      %> FOR
    ]
  </warp-view-tile>
</div>
If you want a bar graph:
<div style="height: 400px; width:100%">
  <warp-view-tile url="https://warp.senx.io/api/v0/exec" responsive="true" type="bar">
    [
      NEWGTS
      0 50
      <%
        'i' STORE
        NOW $i -1 * ADDDAYS NaN NaN NaN RAND 10 * ADDVALUE
      %> FOR
    ]
  </warp-view-tile>
</div>
… or a map
<div style="height: 400px; width:100%">
 <warp-view-tile url="https://warp.senx.io/api/v0/exec" responsive="true" type="map">
          '{"data":[{"c":"A","l":{},"a":{},"v":[[1460540141224657,51.45877850241959,-0.01000002957880497,1000,8.090169943749475],[1460540131224657,51.49510562885553,-0.02000005915760994,1000,3.0901699437494745],[1460540121224657,51.49510562885553,-0.030000004917383194,1000,-3.0901699437494736],[1460540111224657,51.45877850241959,-0.040000034496188164,1000,-8.090169943749473],[1460540101224657,51.39999998733401,-0.050000064074993134,1000,-10.0],[1460540091224657,51.341221472248435,-0.06000000983476639,1000,-8.090169943749475],[1460540081224657,51.3048943458125,-0.07000003941357136,1000,-3.0901699437494754],[1460540071224657,51.3048943458125,-0.08000006899237633,1000,3.0901699437494723],[1460540061224657,51.341221472248435,-0.09000001475214958,1000,8.090169943749473],[1460540051224657,51.39999998733401,-0.10000004433095455,1000,10.0]]},{"c":"B","l":{},"a":{},"v":[[1460540141224657,51.49999998975545,-0.10000004433095455,10],[1460540131224657,51.45999999716878,-0.09000001475214958,9],[1460540121224657,51.41999996267259,-0.08000006899237633,8],[1460540111224657,51.39999998733401,-0.07000003941357136,7],[1460540101224657,51.439999979920685,-0.06000000983476639,6],[1460540091224657,51.47999997250736,-0.050000064074993134,8],[1460540081224657,51.49999998975545,-0.030000004917383194,10],[1460540071224657,51.51999996509403,-0.02000005915760994,9],[1460540061224657,51.539999982342124,-0.01000002957880497,8],[1460540051224657,51.55999999959022,0.0,9]]},{"c":"D","l":{},"a":{},"v":[[1460540141224657,51.49999998975545,-0.10000004433095455,"a"],[1460540131224657,51.45999999716878,-0.09000001475214958,"b"],[1460540121224657,51.41999996267259,-0.08000006899237633,"c"],[1460540111224657,51.39999998733401,-0.07000003941357136,"d"]]},{"c":"E","l":{},"a":{},"v":[[1460540136224657,51.439999979920685,0.05999992601573467,true],[1460540116224657,51.47999997250736,0.04999998025596142,false],[1460540096224657,51.49999998975545,0.02999992109835148,true],[1460540076224657,51.51999996509403,0.019999975338578224,false],[1460540056224657,51.539999982342124,0.009999945759773254,true]]},{"positions":[[51.5,-0.22],[51.46,-0.3],[51.42,-0.2]]},{"positions":[[51.2,-0.12,42],[51.36,-0.0,21],[51.32,-0.2,84]]},{"positions":[[51.2,-0.52,42],[51.36,-0.4,21],[51.32,-0.6,84]]},{"positions":[[51.1,-0.52,42,10],[51.56,-0.4,21,30],[51.42,-0.6,84,40],[51.3,-0.82,42,1],[51.76,-0.7,21,20],[51.62,-0.9,84,45]]}],"params":[{"key":"Path A"},{"key":"Path B"},{"key":"Annotations (text)","render":"marker","marker":"star"},{"key":"Annotations (boolean)","baseRadius":5},{"key":"Test","render":"marker","marker":"circle"},{"key":"points 2","render":"dots","color":"#ffa","borderColor":"#f00","baseRadius":5},{"key":"points","render":"weightedDots","color":"#aaf","borderColor":"#f00","maxValue":100,"minValue":0,"baseRadius":5,"numSteps":10},{"key":"coloredWeightedDots","render":"coloredWeightedDots","maxValue":100,"minValue":0,"baseRadius":5,"maxColorValue":50,"minColorValue":0,"numColorSteps":10,"startColor":"#ff0000","endColor":"#00ff00"}]}'
                    JSON->
  </warp-view-tile>
</div>
See WarpViewTile Full documentation
Atomic components
You can use all those components alone with a WarpScript result:
<div style="width: 100%; height: 400px;">
  <warp-view-result-tile url="https://warp.senx.io/api/v0/exec" responsive="true" type="scatter" data=' {
    "data":[
      {"c":"A","l":{},"a":{},"v":[[1515678481382000,0],[1515678541388000,34344],[1515678601397000,33812],[1515678661402000,34086],[1515678721407000,33124],[1515678781413000,34364],[1515678841419000,35852],[1515678901425000,33229],[1515678961431000,33738],[1515679021436000,34802]]},
      {"c":"B","l":{},"a":{},"v":[[1515678431331000,0],[1515678491337000,34369],[1515678551343000,34498],[1515678611350000,34058],[1515678671356000,35378],[1515678731362000,35081],[1515678791368000,35294],[1515678851374000,33902],[1515678911380000,36927],[1515678971387000,34745]]},
      {"c":"C","l":{},"a":{},"v":[[1515678485202000,0],[1515678545209000,229409],[1515678605215000,214360],[1515678665222000,236297],[1515678725228000,264372],[1515678785235000,224437],[1515678845245000,245184],[1515678905251000,244450],[1515678965258000,243175],[1515679025264000,253690]]},
      {"c":"D","l":{},"a":{},"v":[[1515678481520000,0],[1515678541530000,0],[1515678601540000,0],[1515678661549000,0],[1515678721559000,0],[1515678781569000,0],[1515678841578000,0],[1515678901586000,0],[1515678961594000,0],[1515679021897000,0]]}
    ]
  }'
  options="{}">
  </warp-view-result-tile>
</div>
Available components
- Tile: generic and versatile chart
- Map: a map supporting path, spots and much more
- DrillDown: explore data density
- DataGrid: display tabular data
- Annotation: put on a time axis textual or boolean events
- Charts:
- Line
- Step
- Area
- Bubble
- Scatter
- Bar
- Pie
- Gauge
- Doughnut
- Polar
- Radar
- Image: display an image generated by the WarpScript processing library
- Display: display a simple text or value generated by WarpScript.
Explore by yourself with the demo-site and build awesome dashboards. Let us know what you build with WarpView by sending us screenshot.
Read more
Drawing Server Side - part 1
UFO sightings datasets, the truth is out there... Part 3
W. Files Conspiracy vol. 2: Spy drones over UDP

Senior Software Engineer