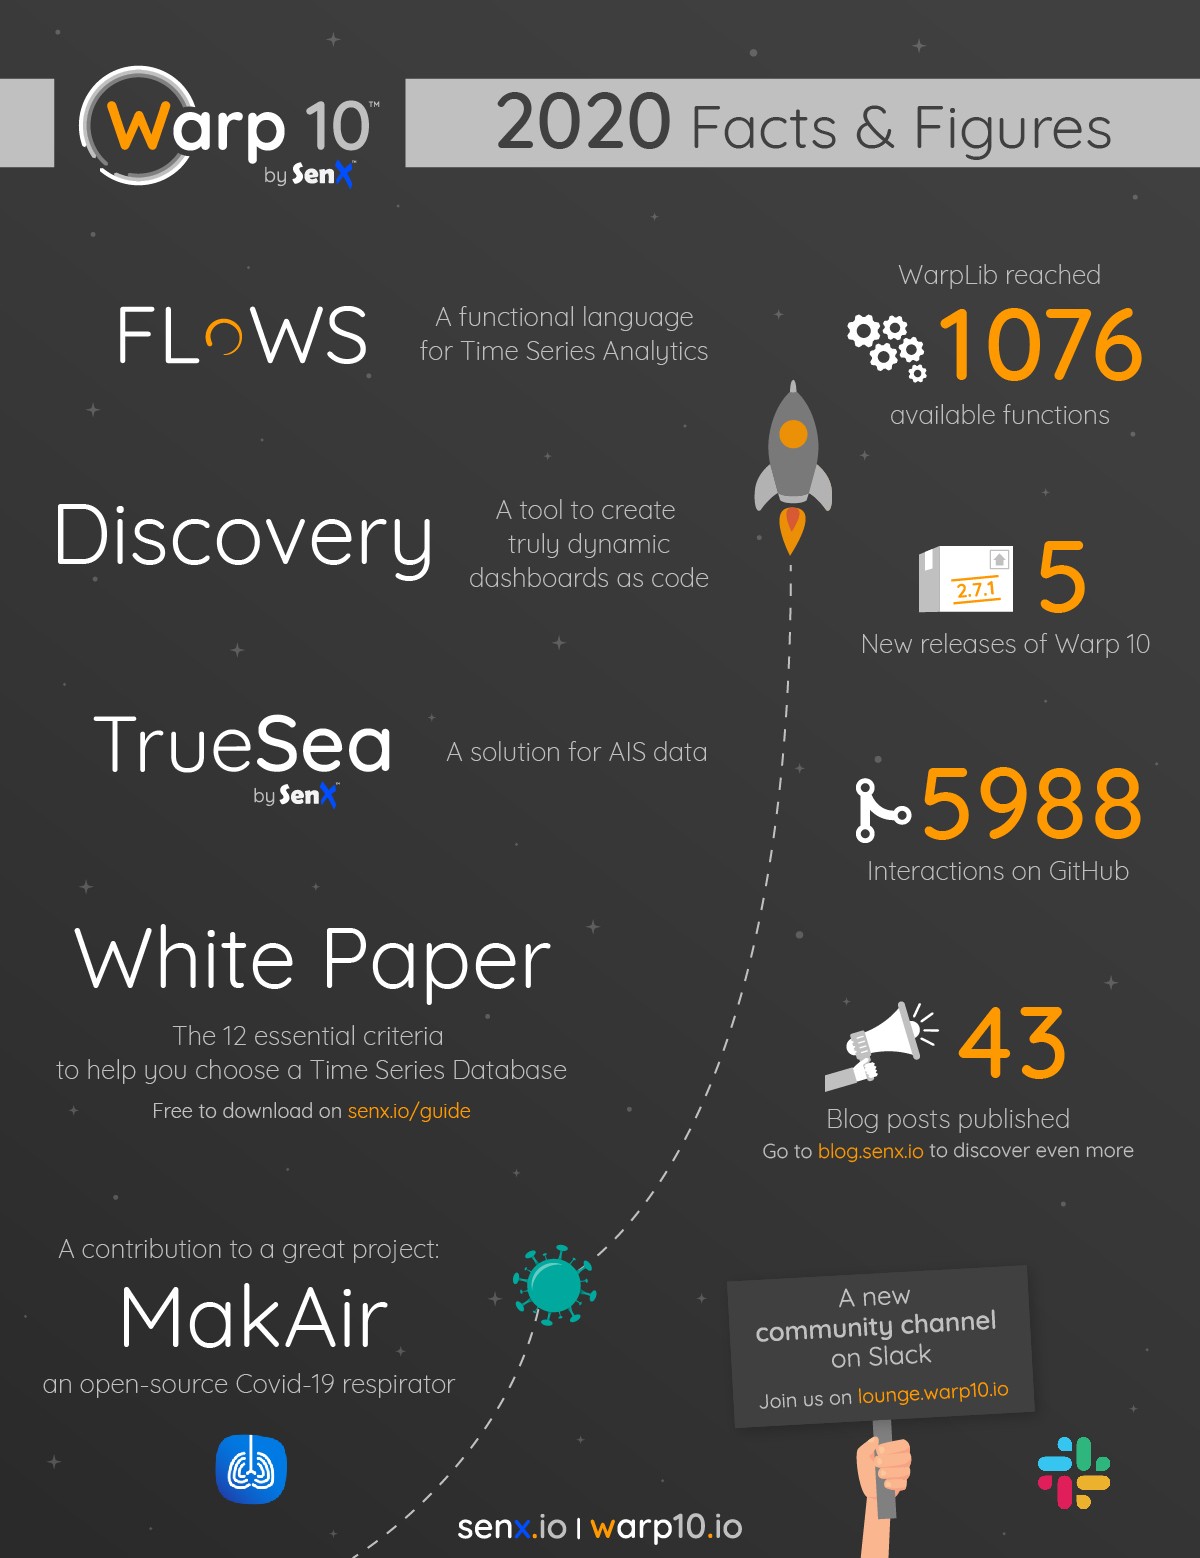
Looking back over the past 12 months to review the news and events that marked the year 2020 for SenX and the Warp 10 Platform.

2020, what a year!
Well, I don’t think we imagined all this when we said “Happy New year 2020”.
If I had to do a summary of 2020, I would talk about the Australian bushfires that burned 47 million acres. The COVID-19 pandemic that has spread in every single country (except for 9). The lockdown and how we learned to make bread and work remotely while handling the kids at home. The end of the lockdown and “It’s OK, you can go to the beach this summer”. The Beirut explosion. Then, “oh in fact you shouldn't have gone to the beach, the pandemic is not over, so keep working remotely”. The police violence. Trump on Twitter… Lockdown #2. And Joe Biden winning the US elections.
It exhausted me just to list these events.
But this article is not about how terrible 2020 has been. I don’t want to depress you. I’m here to announce to you some good news.
Because despite all of this, despite the fact we have been working from home for the last 9 months, the SenX team worked hard. Many new features have been launched this year.
The MakAir project, an open-source COVID-19 ventilator
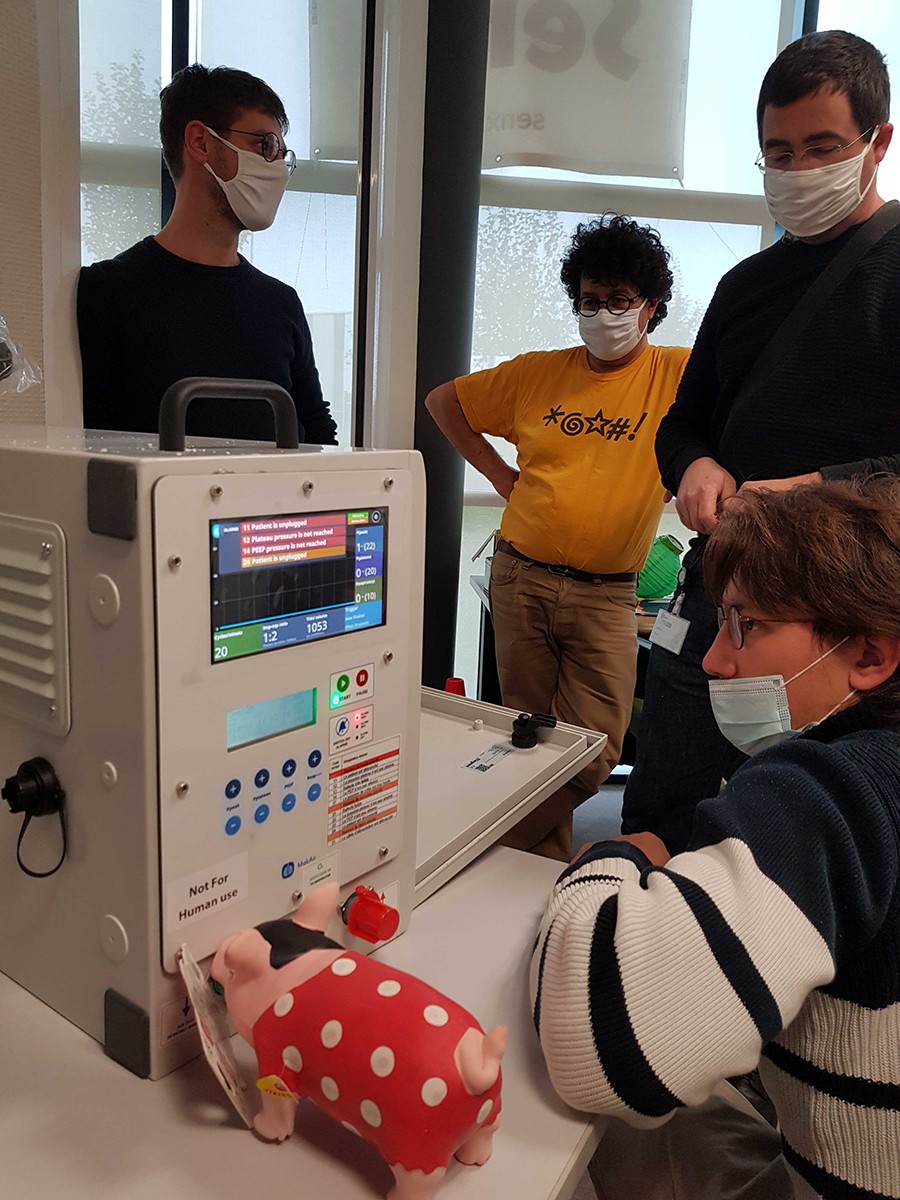
During the lockout, French makers, engineers, and health professionals came together urgently to create a "special COVID" artificial respirator. In addition to having been designed in record time, its particularity is to be fully open-source to allow disadvantaged countries to have access to it.
SenX is proud to be part of this project. Pierre, our electronics engineer, joined MakAir’s team after Quentin Adam (CEO of Clever Cloud and one of the project initiator) called him when they were struggling with the electronics part of the respirator.
+200 people worked 24/7 from scratch to produce a viable respirator. And after only a month, a first version was ready for clinical trials.
Currently, the MakAir respirator has been approved by the French health authorities, and the team is continuing its work to offer an improved version of the device.
You can follow the project on makair.life, and you can read more about it here.
A guide to help you choose your Time Series Database
Many solutions exist to store, manage, and analyze Time Series data. So it can be difficult to know which one will suit your needs. There are plenty of benchmarks on the web, but some are old, some won’t fit your use case, and performance alone should not guide your choice.
So it can be easy to turn to the most popular solution, thinking that “since so many people use it, it will certainly work perfectly for MY use case too!”
But of course, it’s not that simple.
You have many criteria to consider to be sure you make the right choice. As for any piece of infrastructure, the choice of a Time Series Database must take into account the existing components, the role assigned to it, the compatibility with third-party tools, the expected performance level, the available skill set, and of course the financial aspects.
That’s why in March, we have written a guide that lists the 12 criteria that we believe are fundamentals (and why they are fundamentals) for choosing a TSDB.
Here are a few examples:
| The first measure of performance for a time series solution is its ingestion capacity. This indicates the number of measures that can be stored in the solution every second. Given the specificities related to the storage of temporal data, it is important to evaluate this performance according to various scenarios by varying the number of different series affected by the updates, the order in which the data are pushed (chronological, reverse chronological or even random), as well as the size of the update batches and the grouping of the series within these. |
| Many time series solutions are distributed under an Open Source license, but not all projects have the same dynamic. A few indicators to assess this dynamic can be found on the GitHub site, which hosts a large number of Open Source projects. |
We tell you more about it in another blog post, and you can download the free white paper on senx.io/guide.

What’s new in Warp 10 since 2020?
This might be your first visit to this blog (hope it won't be your last), and you might not know what Warp 10 is.
Warp 10 is an Open Source Geo Time Series Platform designed to handle data coming from sensors, monitoring systems, and the Internet of Things. Geo Time Series extends the notion of Time Series by merging the sequence of sensor readings with the sequence of sensor locations. But if your data have no location information, Warp 10 handles them as regular Time Series.
If you want more information about Warp 10, I recommend you watch this short video.
So last year, 5 releases allowed us to add new features and improve the performance of the platform.
Among the new functions:
- The Warp 10 Accelerator, an option of the standalone version of Warp 10 that adds an in-memory cache to a Warp 10 instance. That cache covers a certain period of time and can be used to store data for ultra-fast access.
- The Macro Value Encoder. The 2.5.0 release of Warp 10 brought the possibility to define custom value encoders. Such encoders handle values starting with a colon, interpreting them, and outputting the actual value stored in the Geo Time Series.
- BUCKETIZE.CALENDAR, makes possible the bucketization of GTSs with buckets of 1 month for instance, even if months are of different duration.
- Step and Timestep, which lets you choose a technique to subsample your data when using all of it is irrelevant.
- GEO.BUFFER, a function that lets you "inflate" a GeoJSON, WKT or WKB by creating a buffer around the shape.
- And many more
All these additions have allowed us to pass the 1000 functions available to analyze your time series data. In fact, WarpLib has now 1076 functions. You can find the full list here.
We understand that discovering all the features of the Warp 10 Platform at once can be intimidating, that’s why you can find many articles on this blog to help you with your data analysis. And if you need help or if you just want to chat with the Warp 10 community, besides to be able to contact us via Twitter or Google Groups, you can now join the Lounge, the Warp 10 community on Slack.
[Infographic] New projects, new features, new tools in 2020… Discover how SenX takes sensor data analysis even further. Share on XA new syntax
Since October, you can analyze your time series data using WarpScript, our historical language, or FLoWS.
WarpScript is a very powerful language. But it has proven challenging to learn for people not comfortable with the mental gymnastics required to visualize the parameters and results of function calls.
So we created a new syntax: FLoWS, for Functional Lineage of WarpScript.

FLoWS makes getting started with Warp 10 easier. It is a purely functional language, fully compatible with WarpScript, which means that you can use all of its functions.
The Warp 10 documentation has been updated. You now have access to FLoWS signatures in every function of the doc.
Read FLoWS 101 to learn all there is to know about the new syntax.
A new solution for AIS data
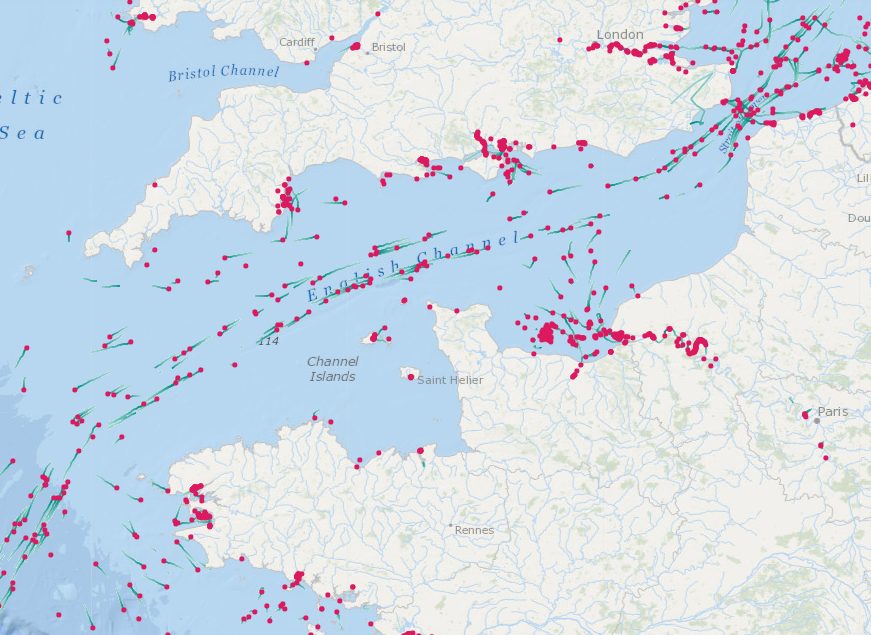
Data from the Automatic Identification System (AIS for short) allows the tracking of vessels around the world. They are being integrated into a growing number of applications from insurance companies, defense agencies, or financial services.
These data are emitted periodically by ships at sea or at moorings and can represent millions of daily messages, bringing with them challenges of their own. But managing those data at scale can prove cumbersome.
That’s why SenX created TrueSea, a turnkey solution for AIS data built on the Warp 10 Geo Time Series Platform.
Compatible with major AIS data providers, it makes that data available through powerful APIs and to batch processing tools such as Spark to enable you to perform large scale analytics to power your applications.
We tell you more about TrueSea in another blog post.
If you are interested in having a conversation about AIS data and how SenX can help, contact us. Meanwhile, you can explore a demo based on TrueSea.
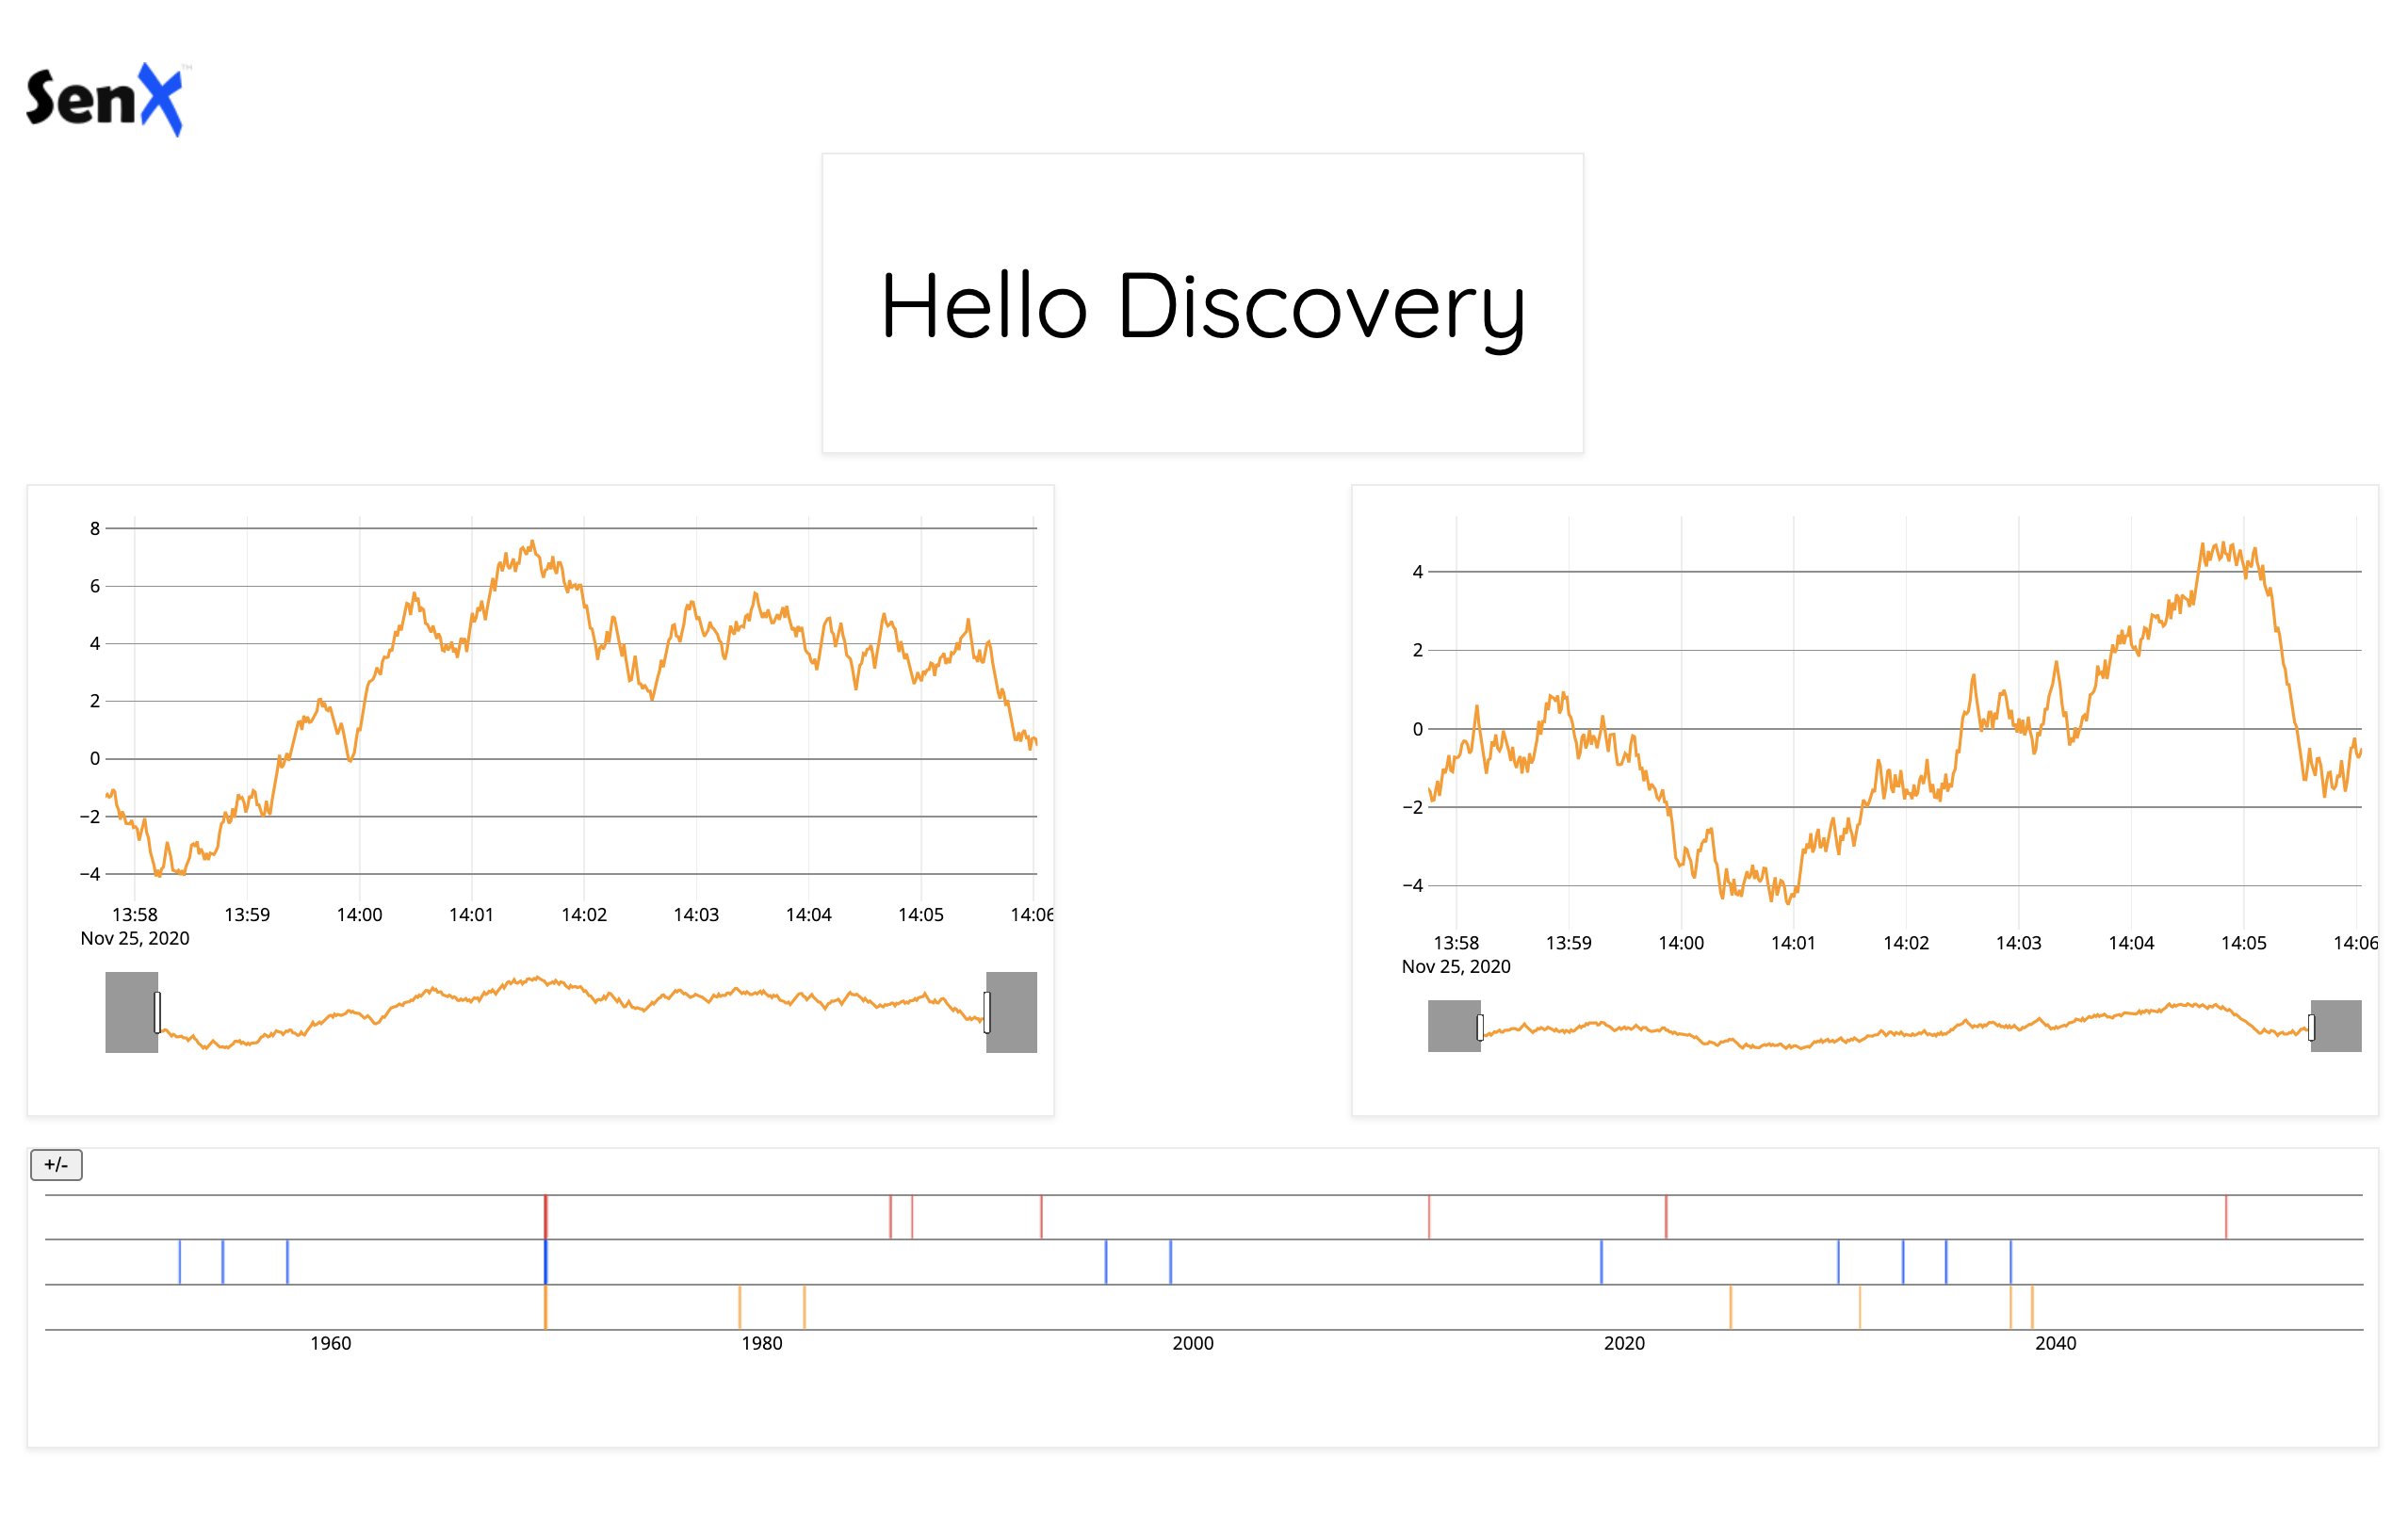
A new tool to create dynamic dashboards as code
And finally, the last feature we developed in 2020 is Discovery, a tool to create dynamic dashboards from your time series data, unique by is Dashboards as Code approach.
When people talk about dashboards, Grafana remains the number one choice for many. And sure, Grafana is great, but it is impossible to create what we call dynamic dashboards.
Imagine for example a dashboard showing the current trend for a system. It will display the last hour of data and will rely on you to spot the anomalies.
A dynamic dashboard on the other hand would also display the last hour of data, as the standard dashboard. But upon detecting a specific situation it would additionally display graphs for other systems, the list of alerts which were triggered, links to knowledge base articles related to the nature of the current incident, and a status of possibly impacted systems, all on the same screen.
With Discovery, creating dashboards is simply a matter of using a specific macro in your WarpScript or FLoWS code.
Discover how to create your dashboards with Discovery.
Takeaways
If you work with time series data, I'm sure you will be interested in some of our new features. Warp 10 is fully open source, and you can even try it out without deploying it, thanks to the Sandbox.
Subscribe to our newsletter or follow us on Twitter to learn what 2021 holds.
And a very Happy New Year 2021!
Read more
Mobilité et données : un train de retard pour la loi LOM
Introducing FLoWS, a functional language for Time Series Analytics
June 2023: Warp 10 release 3.0.0

Digital Communication Manager