Traffic data management made easy with Warp 10. Empower your smart Cities.

Traffic data management made easy with Warp 10, empower your Smart cities.
Here, we will show you how to take advantage of traffic data and do some manipulations in the Smart cities context.
Thanks to Open Data, we can fetch traffic data coming from Rennes. The dataset is available here.
Modelization
Data is in JSON format: https://data.rennesmetropole.fr/api/records/1.0/search/?dataset=etat-du-trafic-en-temps-reel&rows=10&start=0
{
  "nhits": 2317,
  "parameters": {
    "dataset": [
      "etat-du-trafic-en-temps-reel"
    ],
    "timezone": "UTC",
    "rows": 10,
    "start": 0,
    "format": "json"
  },
  "records": [
    {
      "datasetid": "etat-du-trafic-en-temps-reel",
      "recordid": "5f8fc91c240ea532efe5c1f05683b26e386f848b",
      "fields": {
        "predefinedlocationreference": "10273_D",
        "traveltime": 8,
        "datetime": "2019-09-03T11:18:00+00:00",
        "traveltimereliability": 0,
        "geo_point_2d": [
          48.04479275684726,
          -1.6502152435304327
        ],
        "denomination": "Route départementale 34",
        "trafficstatus": "freeFlow",
        "geo_shape": {
          "type": "MultiLineString",
          "coordinates": [
            [
              [
                -1.651560961,
                48.0448858324
              ],
              [
                -1.6499428099,
                48.0447739173
              ],
              [
                -1.6488695266,
                48.0446996735
              ]
            ]
          ]
        },
        "averagevehiclespeed": 92,
        "id": 1,
        "func_class": 0
      },
      "geometry": {
        "type": "Point",
        "coordinates": [
          -1.6502152435304327,
          48.04479275684726
        ]
      },
      "record_timestamp": "2019-09-03T11:22:03+00:00"
    },
    [...
    ]
  ]
}nbhits: total records count.records.fields.predefinedlocationreference: id of the road segment, along with the directionrecords.fields.datetime: UTC date time of the recordrecords.fields.traveltime: average travel time in seconds on this part of the road segment- records.fields.geo_point_2d: location of the road segment
- records.fields.denomination: the road's name
- records.fields.trafficstatus: status of the traffic:
- unknown
- freeFlow
- heavy
- congested
- impossible
- records.fields.geo_shape: geoshape of the road
- records.fields.averagevehiclespeed: average speed measured at a given timestamp
You can model that data into GTS thanks to the multi value support:
<timestamp in microseconds>/lat:lon/ fr.rennesmetropole.trafic{predefinedlocationreference=<records.fields.predefinedlocationreference>} [ "<records.fields.trafficstatus>" <records.fields.averagevehiclespeed> <records.fields.traveltime> ]Some data are constant over time, like records.fields.denomination and records.fields.geo_shape, so you can put it into GTS attributes.
<timestamp in microseconds>/lat:lon/ fr.rennesmetropole.trafic{predefinedlocationreference=<records.fields.predefinedlocationreference>} [ "<records.fields.trafficstatus>" <records.fields.averagevehiclespeed> <records.fields.traveltime> ]Data ingestion
Data is updated every 5 minutes, you don't have access to the history, but you can cron it easily. Here's a NodeJs script which aims to help you: https://gist.github.com/Giwi/5dad9263e13d8851eaef1d09fb081bed
If you don't have a Warp 10 instance yet, you can try it with our Sandbox: https://sandbox.senx.io.
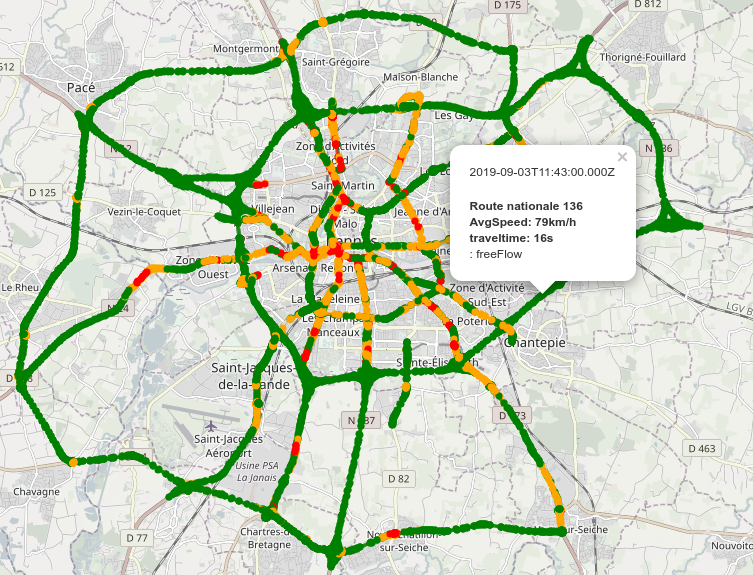
Traffic data management made easy with Warp 10. Empower your smart Cities. Share on XReal-time traffic status
There is an easy way to display the current traffic status with WarpScript, you can use either WarpStudio or VSCode plugin. The output of the script is meant to be used with WarpView. You can adapt it depending on your needs.
[ 'read token' 'fr.rennesmetropole.trafic' {} NOW -1 ] FETCH

// For dataviz, we will use it to add color to the path and a legend in the tooltip
[] 'params' STORE

<%
  // drop the LMAP index
  DROP

  // store the current GTS
  'gts' STORE

  // get the road id provided by the label
  $gts LABELS 'predefinedlocationreference' GET 'name' STORE

  // get the road's name provided in attribute
  $gts ATTRIBUTES 'denomination' GET 'denomination' STORE

  // get the path of the road
  $gts ATTRIBUTES 'geo_shape' GET JSON-> 'geo_shape' STORE

  // get the timestamp of the record
  $gts TICKS 0 GET 'ts' STORE   // extract the multi-values

  $gts MVTICKSPLIT MVVALUES 0 GET 'vals' STORE

  // fetches the status
  $vals 0 GET 'trafficstatus' STORE

  // bind a color to the status
  <% $trafficstatus 'freeFlow' == %> <% 'green' 'color' STORE %>
  <% $trafficstatus 'heavy' == %> <% 'orange' 'color' STORE %>
  <% $trafficstatus 'congested' == %> <% 'red' 'color' STORE %>
  <% $trafficstatus 'impossible' == %> <% 'black' 'color' STORE %>
  <% 'lightgrey' 'color' STORE %>
  4 SWITCH

  // build GTS parameters for dataviz
  $params {
    'color' $color
    'key' $denomination '<br>AvgSpeed: ' +  $vals 1 GET TOSTRING + 'km/h<br>traveltime: ' + $vals 2 GET TOSTRING + 's<br>' +
  } +! DROP

  // build a new GTS
  NEWGTS $name RENAME

  // add a datapoint per node of the geoshape
  $geo_shape
  <%
    'loc' STORE
    $ts $loc 0 GET $loc 1 GET NaN $trafficstatus ADDVALUE
  %> FOREACH
%> LMAP
'data' STORE

// format the output
{
  'data' $data
  'params' $params
}
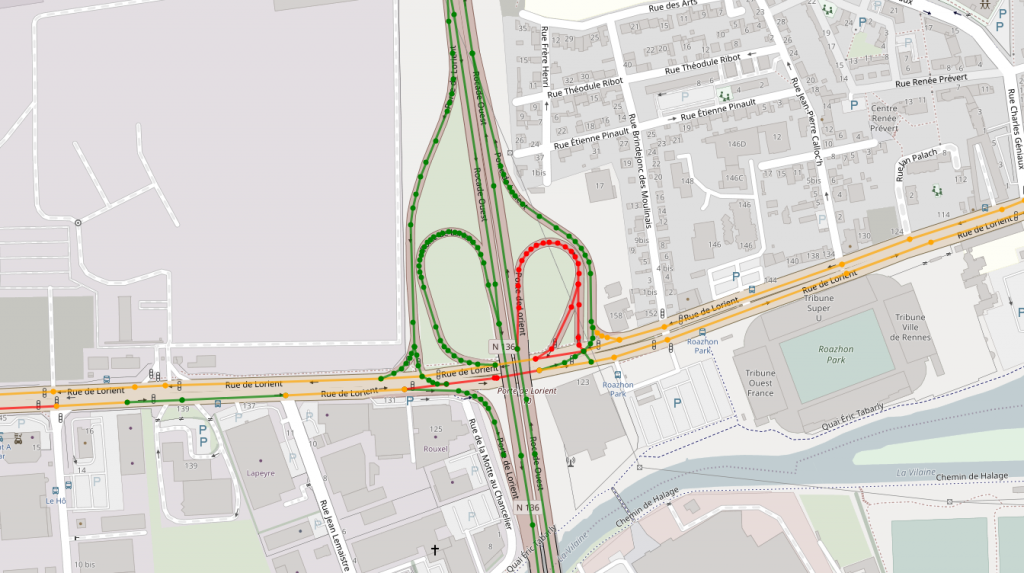
Traffic history in an area
First, we have to define a geo shape, you can do it here: http://geojson.io/#map=14/48.0971/-1.6313
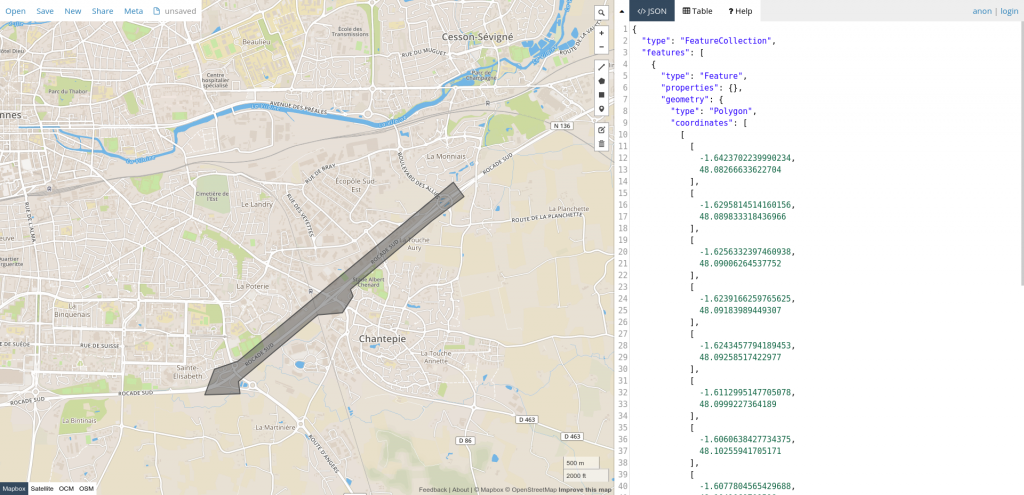
Grab only the geometry.
{
  "type": "Polygon",
  "coordinates": [
    [
      [ -1.6423702239990234, 48.08266633622704 ],
      [ -1.6295814514160156, 48.089833318436966 ],
      [ -1.6256332397460938, 48.09006264537752 ],
      [ -1.6239166259765625, 48.09183989449307 ],
      [ -1.6243457794189453, 48.09258517422977 ],
      [ -1.6112995147705078, 48.0999227364189 ],
      [ -1.6060638427734375, 48.10255941705171 ],
      [ -1.6077804565429688, 48.1041069709598 ],
      [ -1.6282081604003906, 48.092814488898725 ],
      [ -1.6424560546875, 48.084845204471684 ],
      [ -1.6462326049804688, 48.083985135927 ],
      [ -1.6477775573730469, 48.081232819942365 ],
      [ -1.6421127319335938, 48.08134750271524 ],
      [ -1.6423702239990234, 48.08266633622704 ]
    ]
  ]
}
We will use it to filter data:
<'
{
"type": "Polygon",
"coordinates": [
[
[ -1.6423702239990234, 48.08266633622704 ],
[ -1.6295814514160156, 48.089833318436966 ],
[ -1.6256332397460938, 48.09006264537752 ],
[ -1.6239166259765625, 48.09183989449307 ],
[ -1.6243457794189453, 48.09258517422977 ],
[ -1.6112995147705078, 48.0999227364189 ],
[ -1.6060638427734375, 48.10255941705171 ],
[ -1.6077804565429688, 48.1041069709598 ],
[ -1.6282081604003906, 48.092814488898725 ],
[ -1.6424560546875, 48.084845204471684 ],
[ -1.6462326049804688, 48.083985135927 ],
[ -1.6477775573730469, 48.081232819942365 ],
[ -1.6421127319335938, 48.08134750271524 ],
[ -1.6423702239990234, 48.08266633622704 ]
]
]
}
'>
'geoJson' STORE
'READ TOKEN' AUTHENTICATE
10000000 MAXOPS
$geoJson 0.01 false GEO.JSON 'geoshape' STORE
// get last 24 h of data
[ 'READ TOKEN' 'fr.rennesmetropole.trafic' {} NOW 24 h ] FETCH 'gts' STORE
// Filter only data in this geo shape
[
$gts // GTS list
$geoshape // from GEO.JSON
mapper.geo.within // keep inner points
0 // pre
0 // post
0 // occurrence
] MAP
NONEMPTY // exclude empty GTS
'gts' STORE
[
$gts
<%
'dp' STORE
[
$dp 0 GET // timestamp
$dp 4 GET 0 GET // lat
$dp 5 GET 0 GET // lon
NaN // elevation
// extract the average speed
$dp 7 GET 0 GET 'ISO8859-1' ->BYTES UNWRAP VALUES 1 GET TOLONG
]
%> MACROMAPPER
0 0 0
] MAP
'gts' STORE
// down sample to 15 m
[ $gts bucketizer.mean NOW 15 m 0 ] BUCKETIZE 'gts' STORE
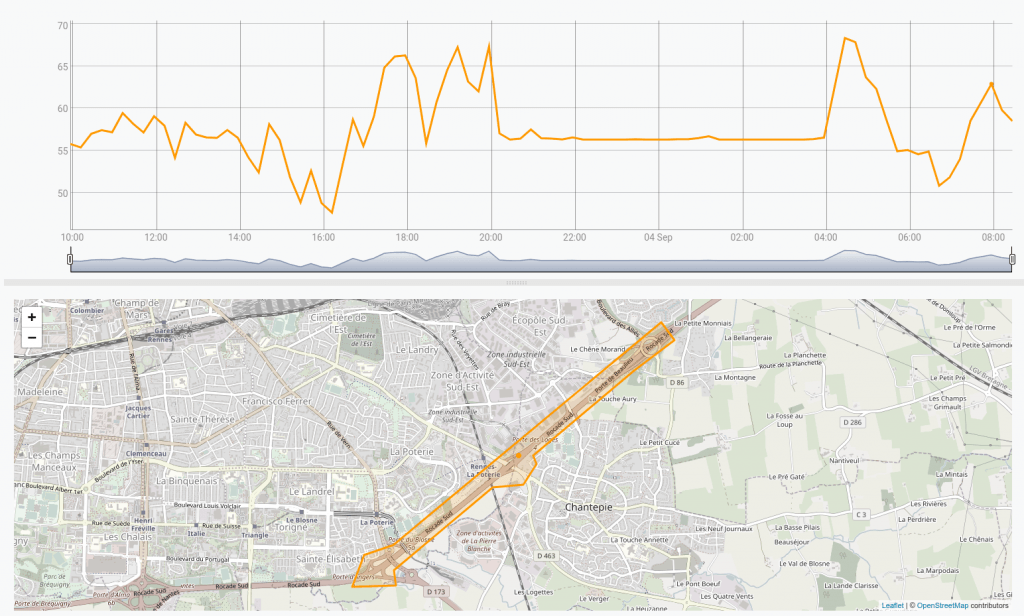
// Now reduce to compute the mean speed over all the area
[ $gts [] reducer.mean ] REDUCE 'gts' STORE
// Draw the area of roads and the speed chart
[
$gts
{
'type' 'Feature'
'properties' { }
'geometry' $geoJson JSON->
}
]
| Learn more about when do you need a Time Series Database |
Enhancement
To compute the average speed in this area, we first fetch all the data points within this timespan and then keep only those that are in the area. This is not efficient. A better alternative is to fetch only data points in the area. To do so, we first need to compute an HHCODE from the centroid of each road part and add it into an attribute.
Run this script once.
'READ TOKEN' 'read' STORE
'WRITE TOKEN' 'write' STORE

$read AUTHENTICATE
10000000 MAXOPS // yes it will be huge

[ $read 'fr.rennesmetropole.trafic' { } NOW -1 ] FETCH // fetch the last known data point

<%
  // Remove list index
  DROP

  'gts' STORE
  [
    $gts
    <%
      // Extract lat + lon
      [ 4 5 ] SUBLIST FLATTEN LIST-> DROP

      // Convert to HHCode
      ->HHCODE 'hhcode' STORE

      // Set HHCode as attribute 'loc'
      $gts { 'loc' $hhcode } SETATTRIBUTES

      // Return NO VALUE
      0 NaN NaN NaN NULL // fake data for the macro mapper
    %> MACROMAPPER
    0 0 0
  ] MAP
  // Discard mapped GTS as we do not need it
  DROP
%>
LMAP
$write  META
And then we can fetch only in the right area using the loc attribute.
[...]
$geoJson 0.01 false GEO.JSON 'geoshape' STORE

'~(' $geoshape GEO.REGEXP + ')' + 'regexp' STORE

// get last 24 h of data
[ $token 'fr.rennesmetropole.trafic' { 'loc' $regexp } NOW  24 h ] FETCH
'gts' STORE
[...]| Execution time | Data-points fetched | |
| Before enhancement | 6.686 s | 1 447 389 |
| After | 456.613 ms | 44 586 |
As you can see, our enhanced version is much faster.
To be continued
This small example should convince you that Warp 10 is a powerful tool to store and manage Smart cities data.
Share your experience with us, we are curious about what you could build with our tool.
Read more
Working with GEOSHAPEs: code contest!
[Interview] How AIM45 uses Warp 10 to analyze ocean races data?
UFO sightings datasets, the truth is out there... Part 2

Senior Software Engineer