WarpScript has support for Apache Arrow Format. Discover what this format is with examples using WarpScript with R, Python and Spark.
Apache Arrow format is an increasingly popular format for columnar in-memory data. Its core goal is to allow a fast, flexible and standardized way to share in-memory data between processes.
In WarpScript, it is possible to convert an object to and from this format using the functions ->ARROW and ARROW->. These functions are available from the extension warp10-ext-arrow.
Installation
If you are an administrator of your Warp 10 instance, you can install the extension from WarpFleet:
wf g io.warp10 warp10-ext-arrow --confDir=/path/to/warp10/etc/conf.d --libDir=/path/to/warp10/libElse, ask an administrator to install it.
Alternatively, you can try it on the sandbox where the extension is installed.
Arrow format
The format used by Apache Arrow is columnar. The columns are called fields and they are named. An object in this format is a set of fields that can be associated with some metadata.
For example, an object in this format can be represented like this:
| Name | City | Day | Value | Accuracy |
| Temperature | Paris | Monday | 293.3 | NULL |
| Temperature | London | Monday | 289.1 | NULL |
| Humidity | Paris | Monday | 64.9 | 2.0 |
| Humidity | London | Monday | 73.0 | 2.0 |
| … | … | … | … | … |
In memory, its data is represented by a set of field-related buffers that can be shared between processes with zero-copy.
There are two kinds of optimization that are done to represent such an object efficiently in memory. First, fields with few possible values (like the three first fields in the previous example) are dictionary-encoded. Second, NULL values are identified by a validity bit buffer that is associated with the value buffer of each field, so that they don't take more space.
In order to share this format, the fields are specified by a schema. In WarpScript, this schema is defined under the hood by the ->ARROW function.
To Arrow format
The function ->ARROW converts a list of GTS into Arrow streaming format (a byte array). At the same time, it moves the data off-heap, so that other processes can pick up the data buffers with zero-copy.
The result, a byte buffer in Arrow format, will have at least a field for the classnames. Then, it will have one field per existing label and attribute key. If there are data points, then there will be a field for each type of values that can be found in the input list: timestamp, latitude, longitude, elevation, double, long, string, bytes, boolean.
Here is an example:
@senx/dataset/temperature

// retrieve a warpscript snapshot of a temperature dataset
[ SWAP 0 2 SUBLIST bucketizer.mean 1508968800000000 1 h 4 ] BUCKETIZE   // selecting a few value for the demo
'data' STORE
[ $data 0 GET                                                           // Portland (4 values)
  $data 1 GET -3 SHRINK                                                 // San Francisco (3 values)
  $data 2 GET 0 SHRINK ]                                                // Seattle (0 values)
->ARROW                                                                 // conversion
We obtain a byte array that can be represented as:
| classname | city | state | timestamp | DOUBLE |
| temperature | Portland | Oregon | 1508968800000000 | 289.63 |
| temperature | Portland | Oregon | 1508965200000000 | 289.63 |
| temperature | Portland | Oregon | 1508961600000000 | 289.26 |
| temperature | Portland | Oregon | 1508958000000000 | 289.11 |
| temperature | San Francisco | California | 1508968800000000 | 302.82 |
| temperature | San Francisco | California | 1508965200000000 | 301.71 |
| temperature | San Francisco | California | 1508961600000000 | 302.08 |
| temperature | Seattle | Washington | NULL | NULL |
The input of ->ARROW was a list of three GTS. Note that a row has also been generated when a GTS was empty (Seattle).
Some metadata are also encoded in the output byte array: the platform number of time unit per second, its revision and the input type.
Also, note that the input list of ->ARROW can also contain GTS encoders or a mix of GTS and GTS encoders.
From Arrow format
The ARROW-> function takes an array of bytes as the argument. If these bytes encode an object in Arrow format, then it will output a list with two objects: a map of metadata, and a map of lists.
For example, append ARROW-> at the end of the previous WarpScript to obtain:
[
    [
        {
            "WarpScriptTimeUnitsPerSecond": "1000000",
            "WarpScriptVersion": "2.8.1",
            "WarpScriptType": "LIST"
        },
        {
            "classname": [
                "temperature",
                "temperature",
                "temperature",
                "temperature",
                "temperature",
                "temperature",
                "temperature",
                "temperature"
            ],
            "city": [
                "Portland",
                "Portland",
                "Portland",
                "Portland",
                "San Francisco",
                "San Francisco",
                "San Francisco",
                "Seattle"
            ],
            "state": [
                "Oregon",
                "Oregon",
                "Oregon",
                "Oregon",
                "California",
                "California",
                "California",
                "Washington"
            ],
            "DOUBLE": [
                289.63,
                289.63,
                289.26,
                289.11,
                302.82,
                301.71,
                302.08,
                null
            ],
            "timestamp": [
                1508968800000000,
                1508965200000000,
                1508961600000000,
                1508958000000000,
                1508968800000000,
                1508965200000000,
                1508961600000000,
                null
            ]
        }
    ]
]
Other input types
The ->ARROW function also supports other input types, even though we encourage using lists of GTS or GTS encoders, as presented above.
For example, you can give as input to ->ARROW a single GTS or a GTS Encoder. In this case, there will be no classname and label/attribute fields in the output but instead, they will be wrapped in its metadata. In this case, ARROW-> will be able to convert such results directly back into a GTS.
More generally, you can also give as input to ->ARROW a list with a map of metadata and a map of lists, similar to the output of ARROW->.
Example with R
To have a working example with R, you need to be able to post a WarpScript (for example with the package warp10r available from its GitHub repository). You also need the R arrow package (installation instructions here).
In the WarpScript example above, use ->ARROW ->HEX to retrieve a hexadecimal string representation of a byte array from the WarpScript json response, then you can use it in R to efficiently retrieve GTS data:
> library(warp10r)
> library(arrow)
> script <- "[ @senx/dataset/temperature 0 2 SUBLIST bucketizer.mean 1508968800000000 1 h 4 ] BUCKETIZE
+ 'data' STORE
+ [ $data 0 GET $data 1 GET -3 SHRINK $data 2 GET 0 SHRINK ] ->ARROW ->HEX"
> ep <- "https://sandbox.senx.io/api/v0/exec"
> response <- postWarpscript(script, outputType="list", endpoint=ep)
 Status: 200
> reader <- RecordBatchStreamReader(hex2raw(response))
> tbl <- read_arrow(reader)
> data.frame(tbl)    classname          city      state        timestamp DOUBLE1
 temperature      Portland     Oregon 1508968800000000 289.632
 temperature      Portland     Oregon 1508965200000000 289.633
 temperature      Portland     Oregon 1508961600000000 289.264
 temperature      Portland     Oregon 1508958000000000 289.115
 temperature San Francisco California 1508968800000000 302.826
 temperature San Francisco California 1508965200000000 301.717
 temperature San Francisco California 1508961600000000 302.088
 temperature       Seattle Washington             <NA>     NA
Example with Python: Arrow vs Pickle
Another example of a library that also supports Arrow is the Pandas library in Python.
To convert a Geo Time Series into a Pandas DataFrame, we can then either use Pickle or Arrow. Which one is faster? Let's find out.
You will need Warp 10 Jupyter ( pip install warp10-jupyter ) and the Py4J plugin installed on your Warp10 instance.
Then start a Jupyter notebook.
%load_ext warpscript%%warpscript --stack stack
NEWGTS 'name' RENAME
1 1000000 <% s RAND RAND RAND 1000 * TOLONG RAND ADDVALUE %> FOR
'gts' STOREimport pickle as pk
import pyarrow as pa
import pandas as pdWarpScript to Pandas via Arrow
%%timeit -n 1 -r 10
stack.exec("$gts ->ARROW") // $gts has 1M datapoints
pa.RecordBatchStreamReader(stack.pop()).read_pandas()
3.34 s ± 98.6 ms per loop (mean ± std. dev. of 10 runs, 1 loop each)
WarpScript to Pandas via Pickle
%%timeit -n 1 -r 10
stack.exec("$gts ->PICKLE") // $gts has 1M datapoints
gts = pk.loads(stack.pop())
gts.pop("classname")
gts.pop("labels")
gts.pop("attributes")
pd.DataFrame.from_dict(gts)
5.55 s ± 157 ms per loop (mean ± std. dev. of 10 runs, 1 loop each)
As observed, using Arrow is much faster. This is due to a more compact serialization scheme and a zero-copy read of data buffers.
Example with PySpark
Spark also has built-in support for Apache Arrow format. To enable Arrow in Spark, you have to set "spark.sql.execution.arrow.enabled" to "true" in Spark configuration. Then, conversions between Pandas and Spark dataframe will be done using Arrow under the hood.
Start another notebook to test that:
%load_ext warpscriptimport pyspark
import numpy as np
import pandas as pd
import pyarrow as pa
from pyspark.sql import SparkSession
from pyspark.ml.feature import VectorAssembler
from pyspark.ml.clustering import KMeans
import matplotlib.pyplot as plt
%matplotlib inlineGenerate a random Geo Time Series and convert to Arrow
We generate a GTS indexed from 1s to 1000s, with random latitude and longitude, without elevation nor value:
%%warpscript -v
NEWGTS 1 1000 <% s RAND RAND NaN NaN ADDVALUE %> FOR->ARROW
If you want more details about how to generate random GTS, follow this link.
Set the Spark session and configuration to enable Arrow
spark = SparkSession.builder.appName("single_machine_test").getOrCreate()
spark.conf.set("spark.sql.execution.arrow.enabled", "true")
Create a Spark DataFrame from GTS data
pdf = pa.RecordBatchStreamReader(stack.pop()).read_pandas() # zero-copy read
df = spark.createDataFrame(pdf) # also uses Arrow buffers under the hood
df.show(10)
+---------+----------+-----------+------+
|timestamp| latitude| longitude|DOUBLE|
+---------+----------+-----------+------+
| 1000000|0.15794925|0.042424582| null|
| 2000000|0.77125925| 0.19479936| null|
| 3000000| 0.8854866| 0.5375395| null|
| 4000000| 0.8703175| 0.02251245| null|
| 5000000|0.57104236| 0.6803281| null|
| 6000000|0.56812847| 0.69224846| null|
| 7000000|0.77577066| 0.5169972| null|
| 8000000| 0.5041205| 0.9198266| null|
| 9000000| 0.5558393| 0.42196748| null|
| 10000000|0.27434605| 0.4202067| null|
+---------+----------+-----------+------+
only showing top 10 rowsExample of using an algorithm implemented in Spark
df = VectorAssembler(inputCols=["latitude", "longitude"], outputCol="features").transform(df)
model = KMeans(k=4, seed=1).fit(df.select("features"))
df = model.transform(df)
df.select("timestamp", "latitude", "longitude", "prediction").show(10)
+---------+----------+-----------+----------+
|timestamp| latitude| longitude|prediction|
+---------+----------+-----------+----------+
| 1000000|0.15794925|0.042424582| 0|
| 2000000|0.77125925| 0.19479936| 2|
| 3000000| 0.8854866| 0.5375395| 1|
| 4000000| 0.8703175| 0.02251245| 2|
| 5000000|0.57104236| 0.6803281| 1|
| 6000000|0.56812847| 0.69224846| 1|
| 7000000|0.77577066| 0.5169972| 1|
| 8000000| 0.5041205| 0.9198266| 1|
| 9000000| 0.5558393| 0.42196748| 2|
| 10000000|0.27434605| 0.4202067| 0|
+---------+----------+-----------+----------+
only showing top 10 rowsReading data back in Pandas for visualization (still using Arrow buffers under the hood)
pdf = df.select("latitude", "longitude", "prediction").toPandas()
fig = plt.scatter(pdf.latitude, pdf.longitude, c=pdf.prediction)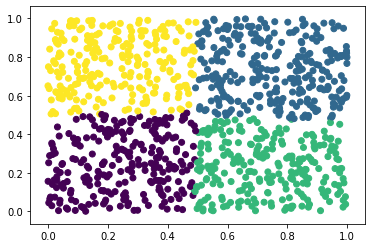
In this simple example, we converted a Geo Time Series in an Arrow format in WarpScript, then Spark and Pandas were able to use the same Arrow buffer.
The same kind of processing pipeline can also be done with R and SparklyR.
Conclusion
Arrow provides a powerful data representation format that enables fast communication between processes.
Arrow is supported in WarpScript through the extension warp10-ext-arrow.
Read more
Speeding up your analytics with SHM
Server monitoring with Warp 10 and Telegraf
Archiving Time Series Data into Amazon S3

Machine Learning Engineer