Discover how to connect Tableau to Warp 10, an alternative to WarpView

Tableau is a nice tool for DataViz and can be an alternative to WarpView. With a few simple steps, you can import your Warp 10 datasets into it. This post will explain to you how.
Tableau helps you to build analytics dashboard. Connect it to Warp 10 to ease the dataviz of time series.
Here, we will use https://rdc.codezero.xyz/#/rest-explorer to connect both tools. We will also use HTTPPlugin embedded with Warp 10.
Add an API
First, use the Warp 10 HTTPPlugin to add an API for WarpScript, tableau.mc2:
{
  // root path
  'path' '/tableau'

  // allow to get path info
  'prefix' true

  // parse manually the payload
  'parsePayload' false

  'macro' <% @senx/tableau/httpHandler %>
}
Read this post to learn more about HTTPPlugin and how to activate it.
Open Tableau
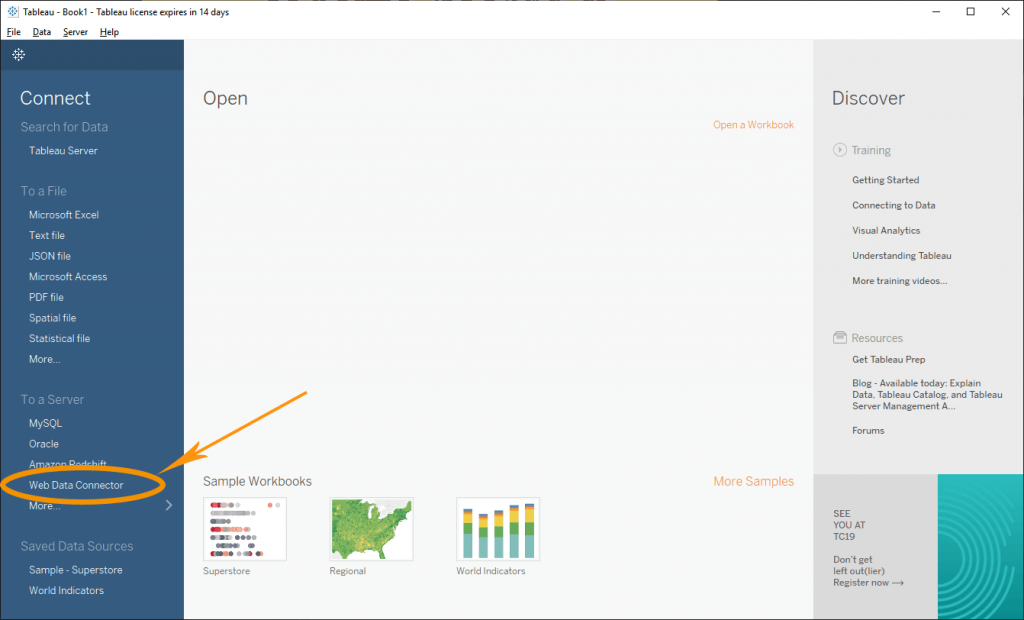
In order to add Warp 10 as a data source, choose "Web Data Connector":
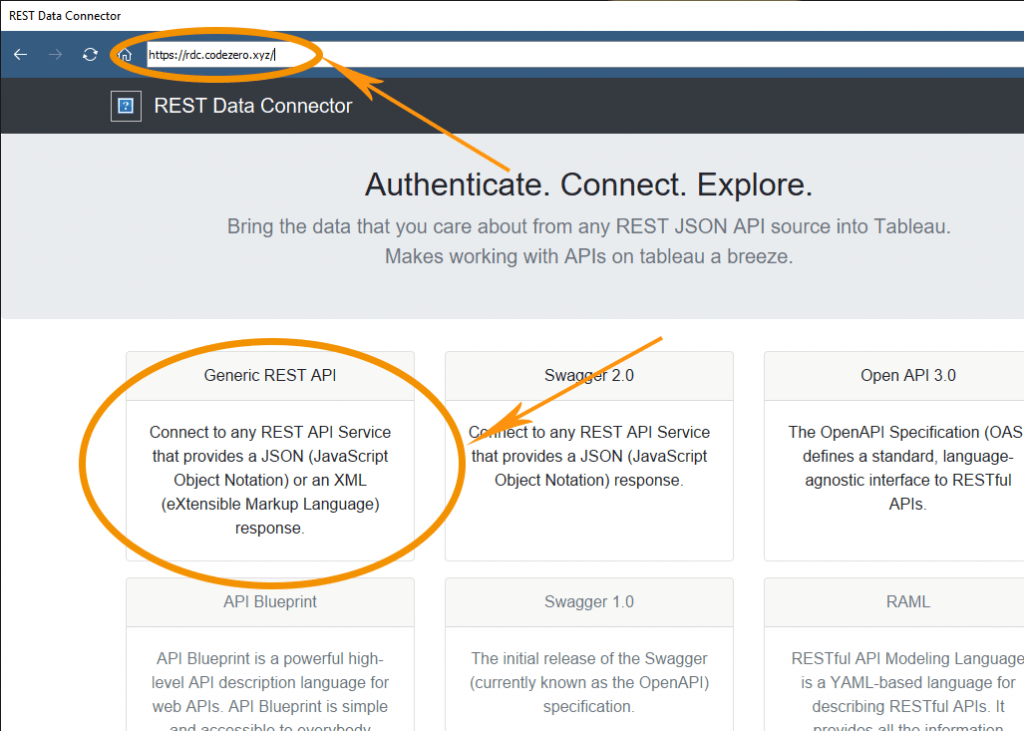
Then enter this URL: https://rdc.codezero.xyz/#/rest-explorer. Choose "Generic REST API":
Insert your Warp 10 HTTPPlugin URL, select "POST" and insert your WarpScript. Then click on "Make request":
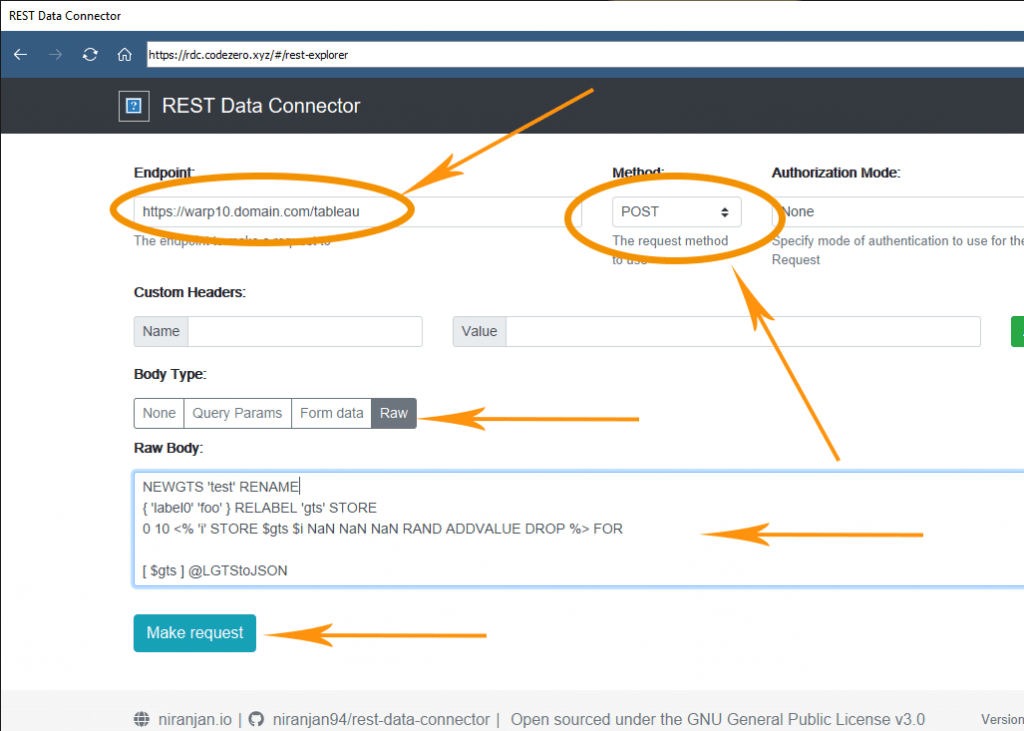
Here is the WarpScript to use. It creates a dummy GTS with 10 random values.
NEWGTS 'test' RENAME // create a dummy GTS
{ 'label0' 'foo' } RELABEL 'gts' STORE // relabel it and store it

// populate it with random data points.
0 10 <% 'i' STORE $gts $i NaN NaN NaN RAND ADDVALUE DROP %> FOR

// then serialize it with the previous macro
[ $gts ] @senx/utils/LGTStoJSON
Of course, you can use your own WarpScript, it could look like that:
[ '<your read token>' 'io.warp10.className' {} NOW 1 w ] FETCH
@senx/utils/LGTStoJSON
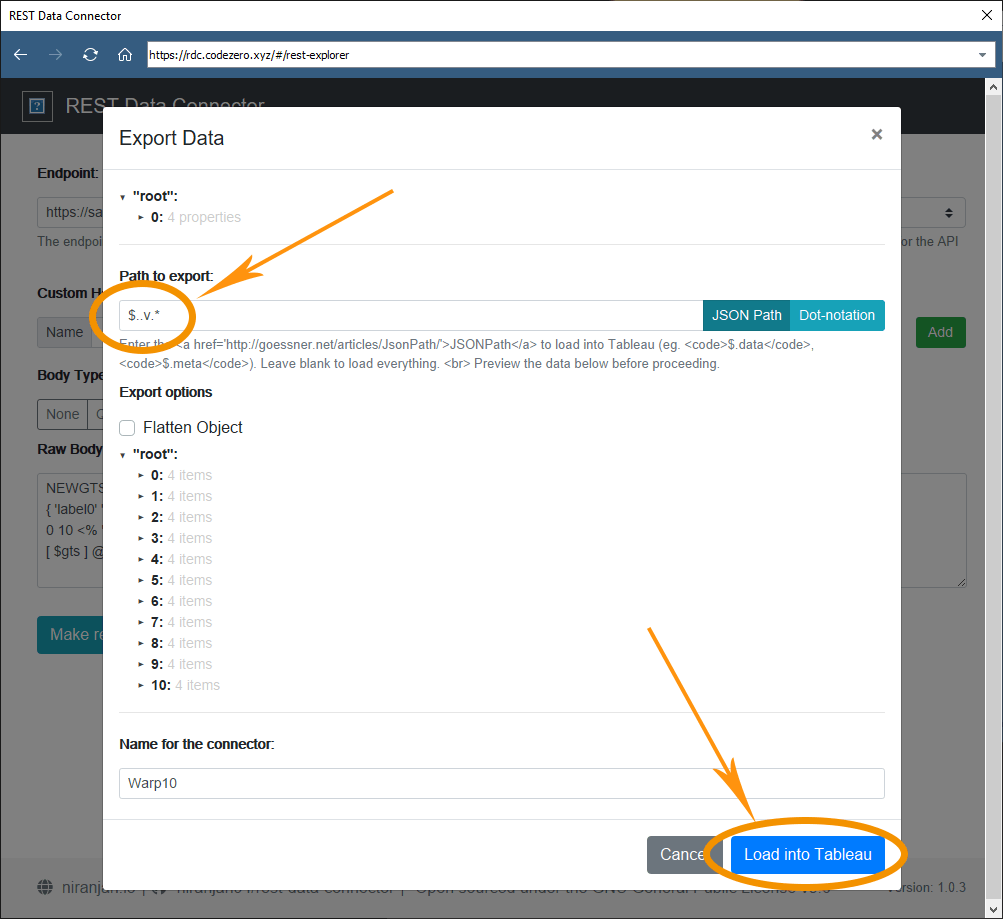
Type this JSON path $..v.* in order to extract only data points and then load them into Tableau:
Update the new data source:
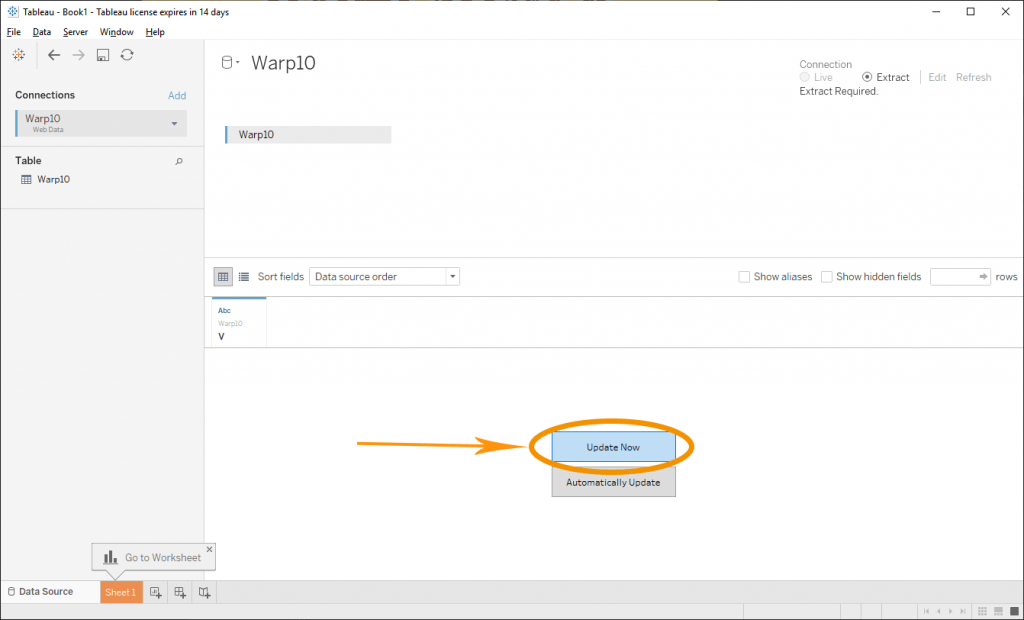
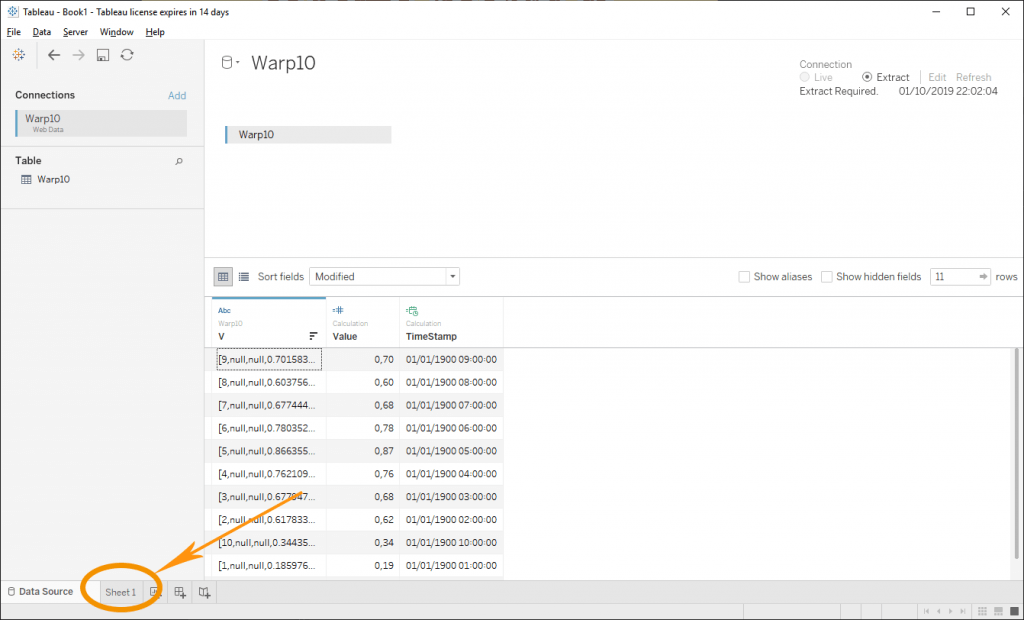
Now it's time to extract values and timestamps. To do so, create computed fields:
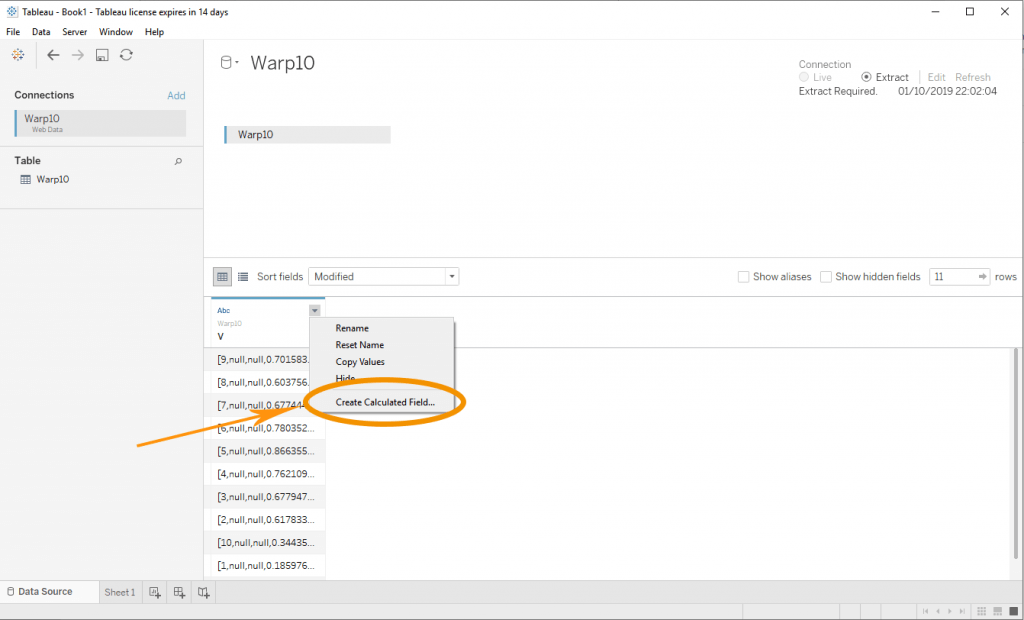
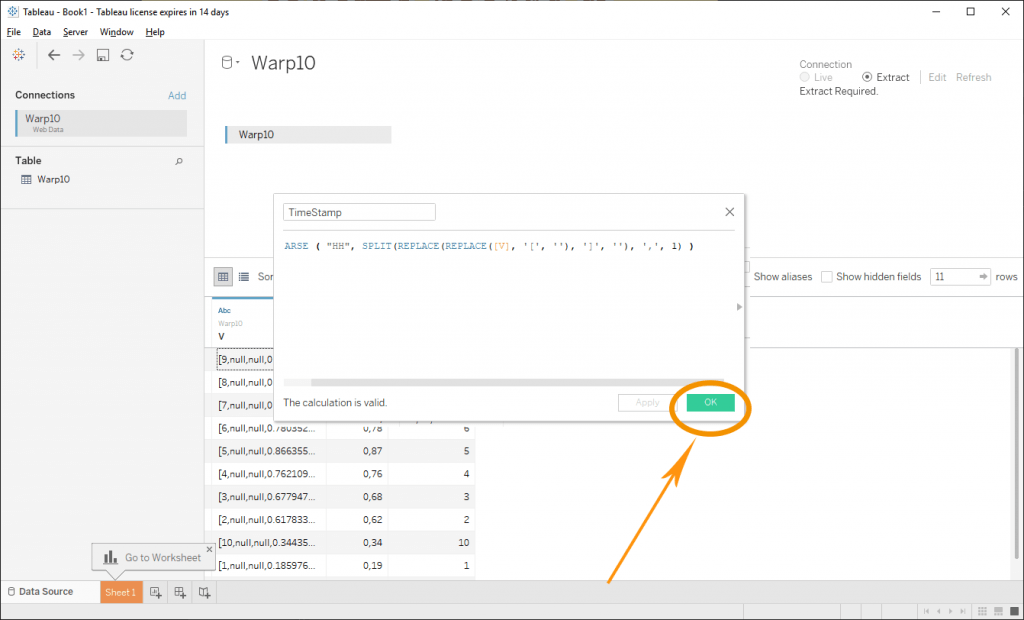
First, compute the timestamp using this code: DATEPARSE ( "HH", SPLIT(REPLACE(REPLACE([V], "[", ""), "]", ""), ",", 1) )
Now, extract the value with this code: FLOAT(SPLIT(REPLACE(REPLACE([V], "[", ""), "]", ""), ",", 4))
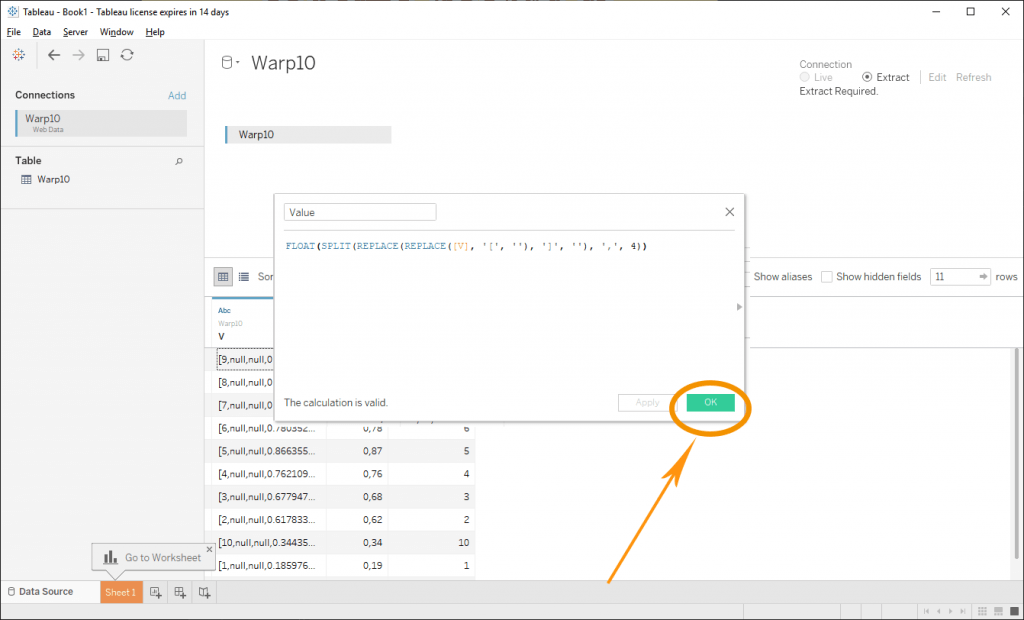
We do not care here about the location, but, it would be the same process.
Now open the Data Sheet:
Drag'n drop the Timestamp dimension into the columns field and the Value into the row field. For both of them, open the menu (at the right of each green pill), choose "Continuous". For the Timestamp, choose "Exact date". Finally, in "Marks" choose the line.
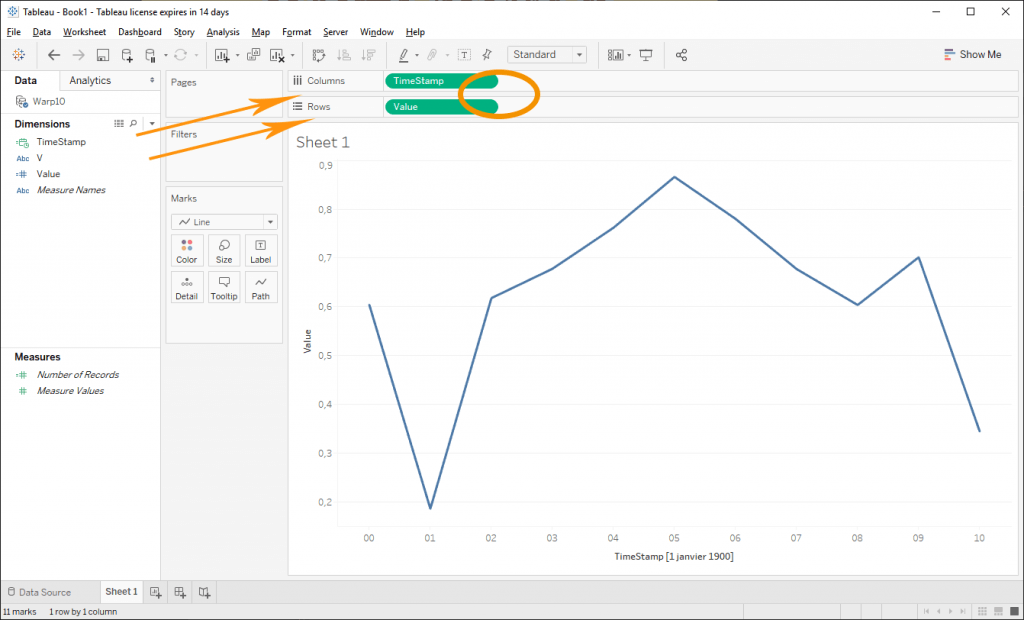
That’s all.
Disclaimer
I am not a Tableau expert. For DataViz, I rather use WarpView for custom dashboards, this is the easiest way to build HTML pages with embedded charts directly fed by WarpScript. I am pretty sure, there are better ways to do it. Contact us to explain how you would tackle this integration.
Read more
HTTP Plugin
WarpStudio v2: What's new in our Web IDE?
Review of DELL compatible batteries using Warp 10

Electronics engineer, fond of computer science, embedded solution developer.