Learn how to query time series from Warp 10 in Microsoft Power BI. YES, you can connect Power BI to Warp 10 and do WarpScript within Power Query M!
A few weeks ago, a Microsoft Power BI user asked me how to connect to Warp 10. Good question.
I am not a Power BI expert, but the short answer is YES. It is possible, with the advanced query editor.
As my fuel burner suddenly became an important cost center for my house, why not try to aggregate my fuel consumption in Power BI?
Times Series in Power BI?
Well… No, there is no straightforward way to send GTS lists to Power BI. Warp 10 is designed for time series, Power BI is designed to manipulate and aggregate tables. So, ultimately, you will press "convert to table". And you have to build a JSON that Power BI can understand easily. After several tries, this kind of JSON is easy to parse for Power BI:
[
    {
        "t": "2022-01-15T00:00:00.000000Z",
        "L per day": 4.2753381135
    },
    {
        "t": "2022-01-16T00:00:00.000000Z",
        "L per day": 7.597284831500001
    },
    {
        "t": "2022-01-17T00:00:00.000000Z",
        "L per day": 6.606801996000001
    },
]
This is not really efficient, but Power BI is not designed to manipulate billions of data points. In order to convert a GTS into this JSON, you can use this simple macro:
<%
    'g' STORE
    []
    [ $g
    <%
        'i' STORE
        { 't'       $i 0 GET ISO8601
          $g NAME   $i 7 GET 0 GET
        } +!
        [ 0 NaN NaN NaN NULL ]
    %>
    MACROMAPPER 0 0 0 ] MAP DROP
%> 'gtsToTable' STORE
To begin with something simple, I will explain step by step how to do a request to Warp 10, starting with a single value query.
| Why Excel IS NOT a time series database! |
Step 1: advanced query editor
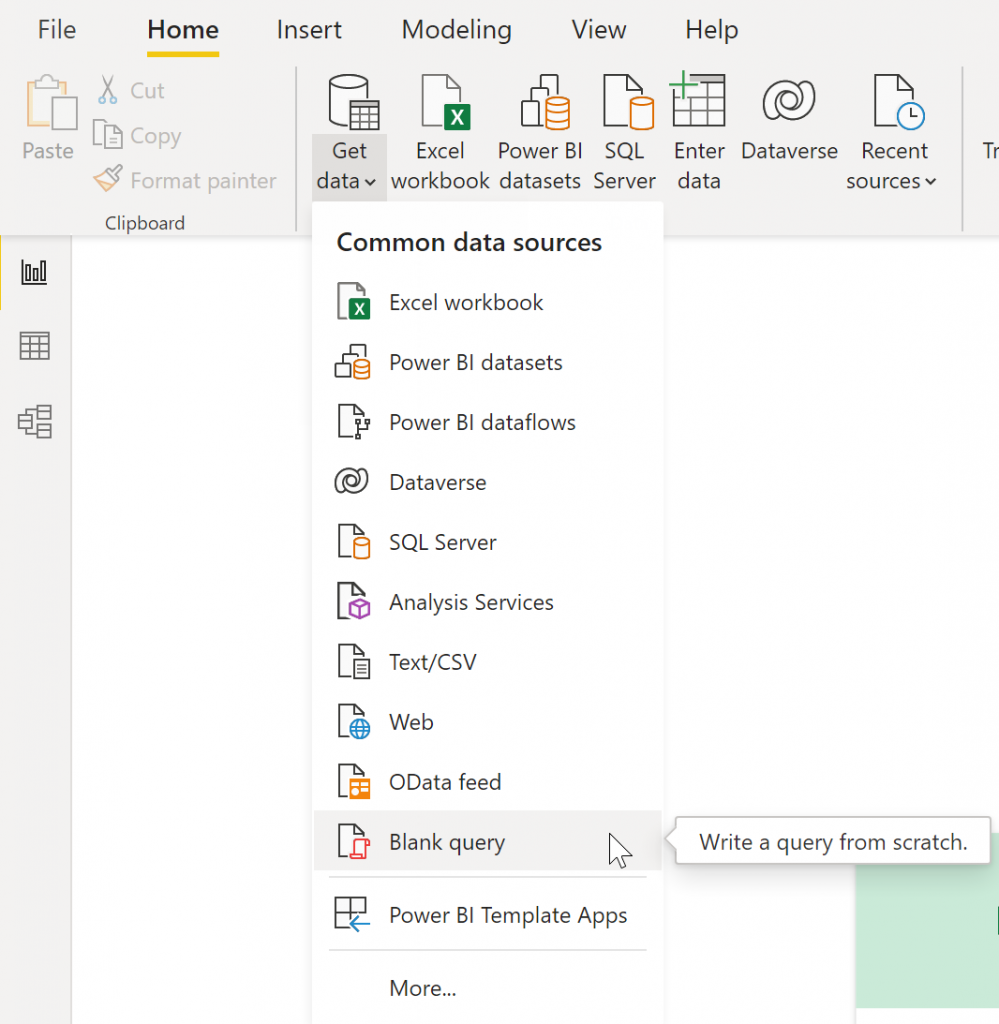
Once Power BI is launched, press Get Data, and select a blank query:
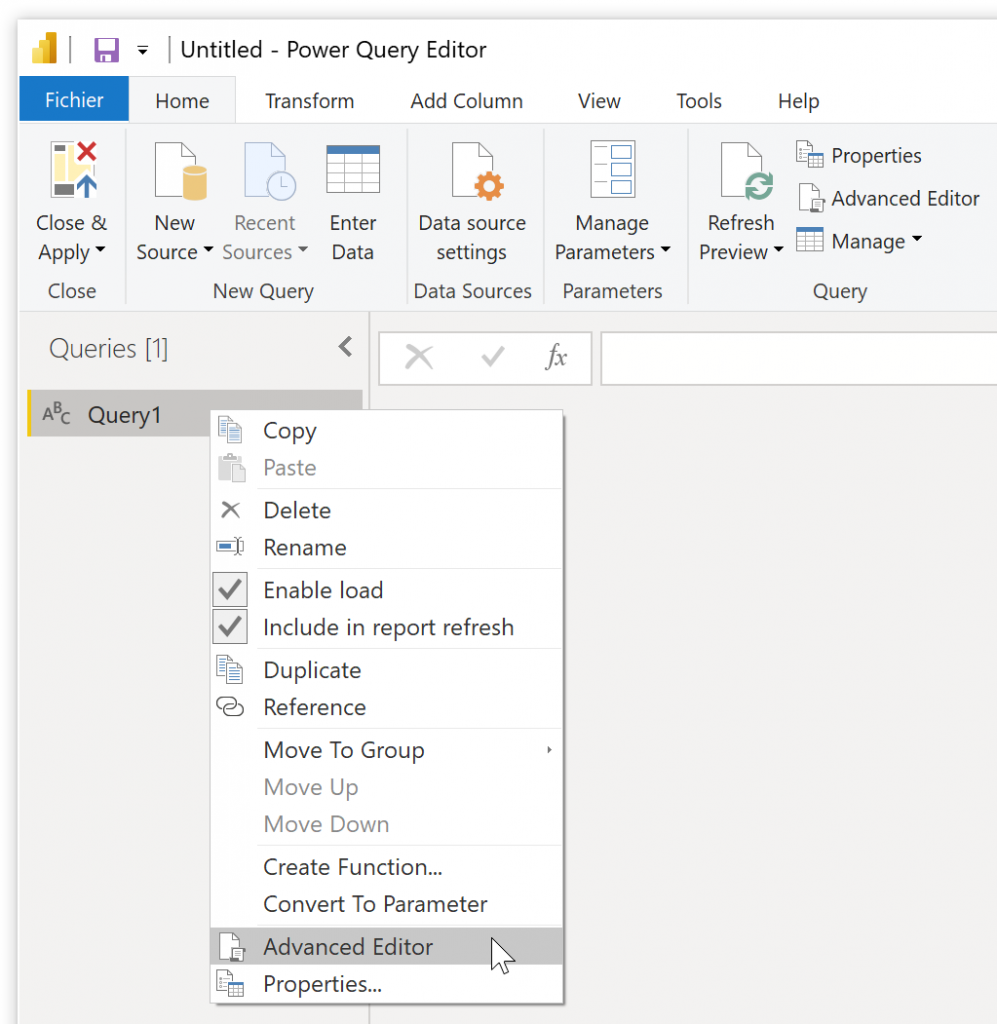
Then right-click Query to open the advanced editor:
Now, you can do a POST request to the Warp 10 API exec endpoint with Power BI. Don't forget to check encoding. Good surprise, utf-8 is the default.
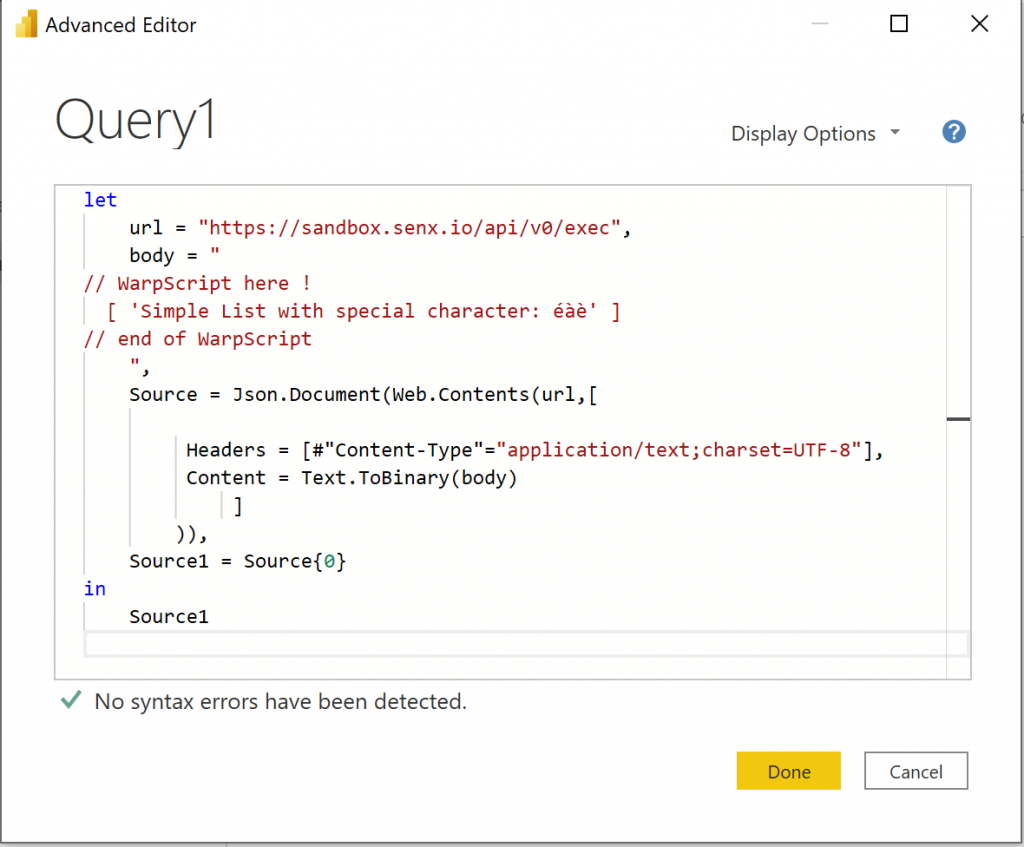
Here is the code template, replace with your WarpScript and your endpoint:
let
    url = "https://sandbox.senx.io/api/v0/exec",
    body = "
// WarpScript here !
  [ 'Simple List with special character: éàè' ]
// end of WarpScript
    ",
    Source = Json.Document(Web.Contents(url,[
         Headers = [#"Content-Type"="application/text;charset=UTF-8"],
         Content = Text.ToBinary(body)
             ]
        )),
    Source1 = Source{0}
in
    Source1
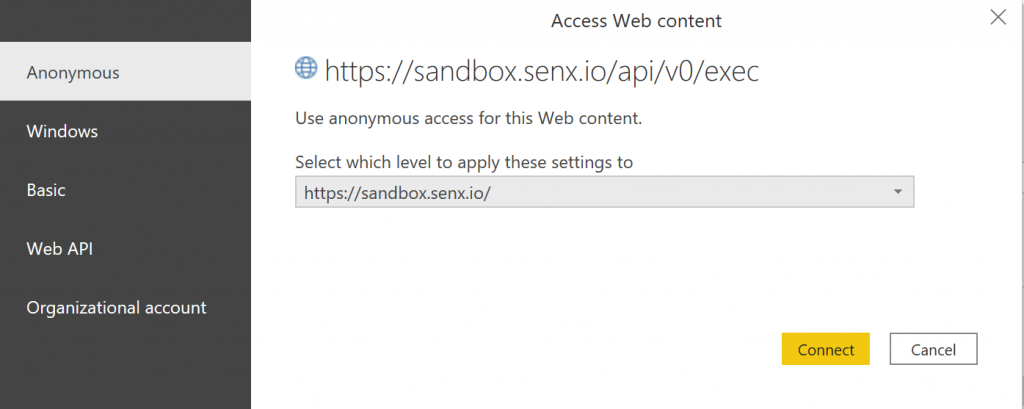
Click done to close the editor. The request should be immediate, and the first time, Power BI will ask for credentials:
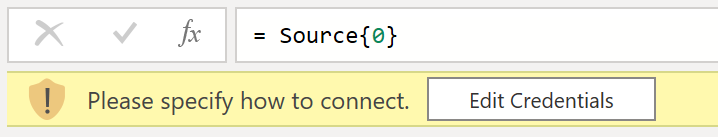
Click Edit Credentials, keep the default anonymous settings, and click Connect.
You should read the WarpScript output. You can now close the request editor.
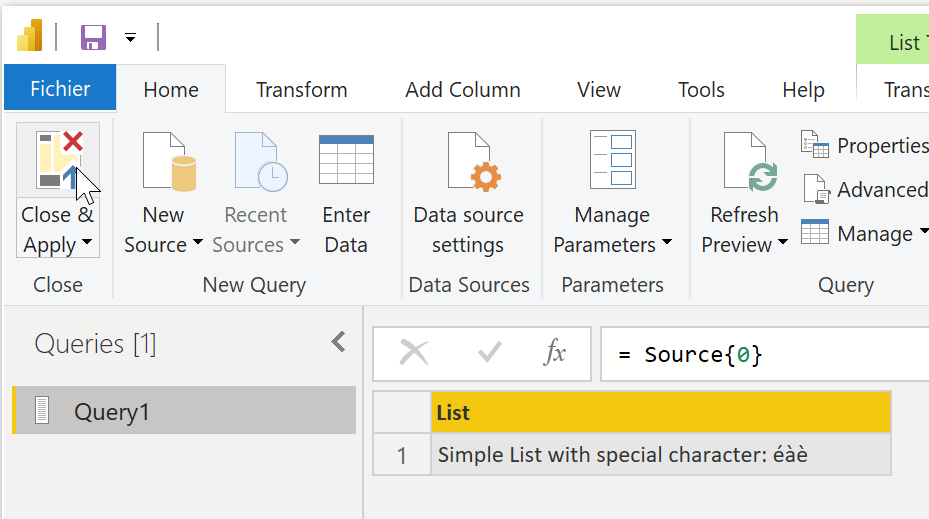
Step 2: display in a card
Back to the main interface, you now have a query on the right pane. Select a card display, then drag and drop the query result to it, and resize. You should see your WarpScript output.
OK, that is great to display one metric, for example, the number of liters your fuel burner burned today.
Now, I will do a request to get the number of liters each day. A real GTS named "L per day", that contains doubles.
| Read more: Connecting Tableau and Warp 10 |
Step 3: GTS to Power BI
Repeat the first step to make a new query and open the advanced editor:
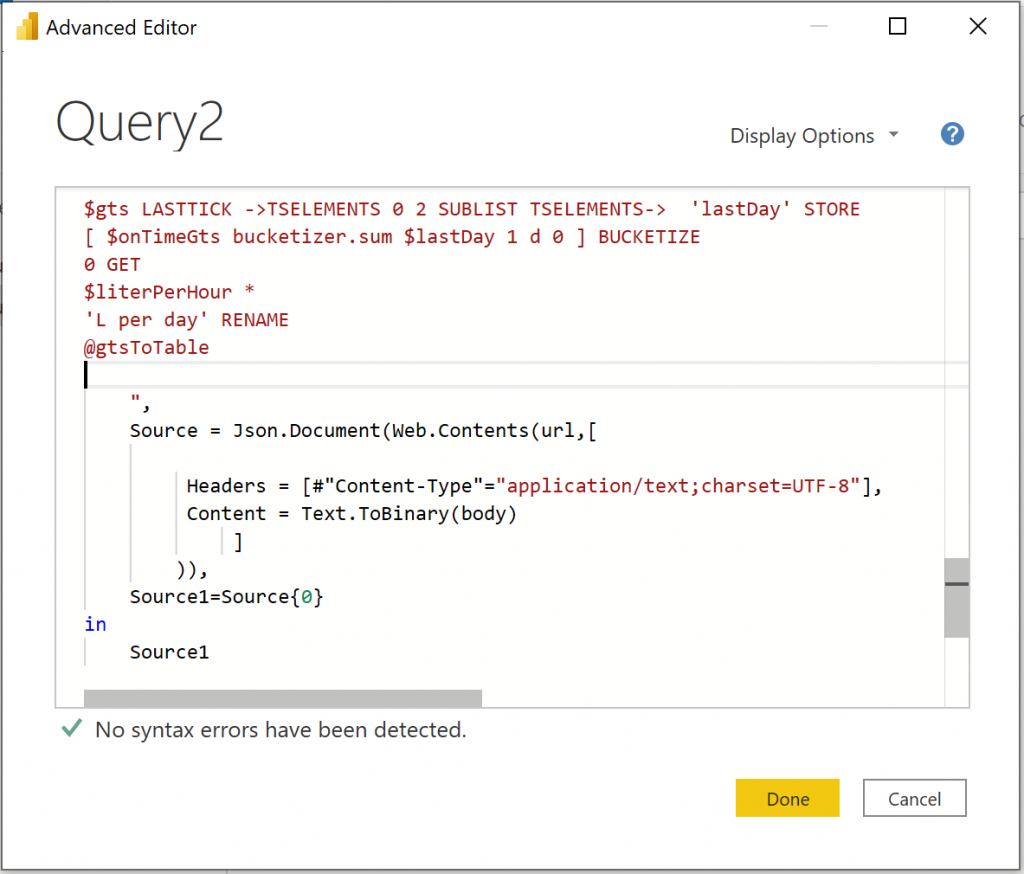
The @gtsToTable refers to the macro at the beginning of this blog post. The way to connect a fuel burner to Warp 10 is detailed in this post.
The output is:
[
[
{
"t": "2022-01-15T00:00:00.000000Z",
"L per day": 4.2753381135
},
{
"t": "2022-01-16T00:00:00.000000Z",
"L per day": 7.597284831500001
},
(...)
{
"t": "2022-01-17T00:00:00.000000Z",
"L per day": 6.606801996000001
},
]
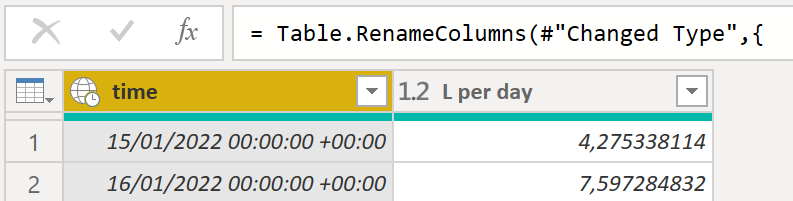
]Again, the first level of the list (first element of the stack) is handled by Source1 = Source{0}. The request output should show a list. Now, click convert to table, then expand columns, then select the right type for time and value. ISO8601 is correctly parsed with Date/Time/Timezone setting.
You can also double click columns to rename them:
Step 4: plot data
Again, this is lots of drag and drop:
Conclusion
Can I connect Power BI to Warp 10? YES!
As soon as a third-party tool is able to communicate with a REST API with JSON, our answer is YES, this tool can connect to Warp 10. Just give me a demo version of the software and a few hours.
I am not a Power BI user. There may be a better or even simpler way to do it. Contact us if you want me to update this article, SenX team is always available on the Warp 10 lounge.
Read more
Warp 10 and the WarpScript/FLoWS dev in your CI/CD pipeline
WarpScript ❤️ Kafka Streams
Archiving Time Series Data into Amazon S3

Electronics engineer, fond of computer science, embedded solution developer.