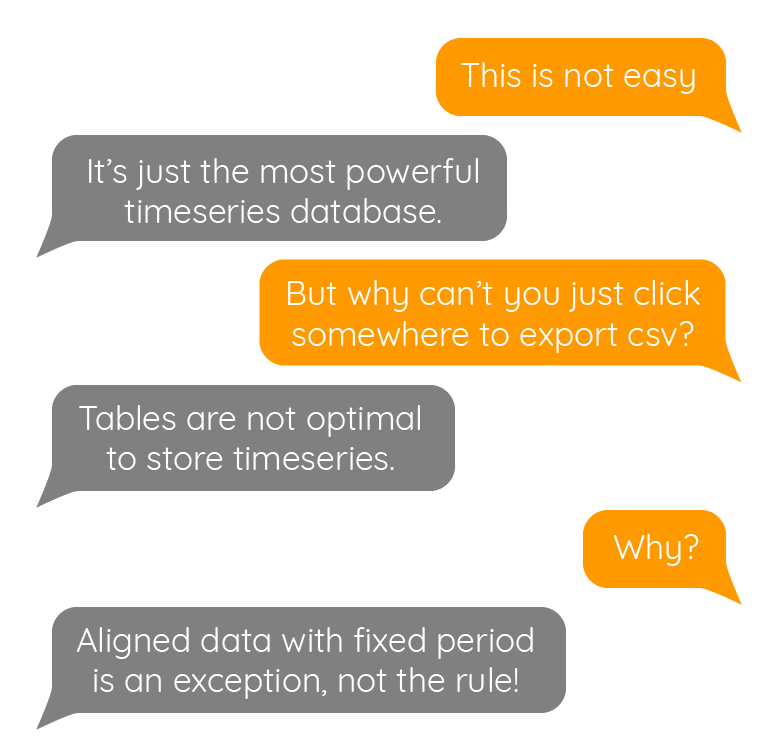
Export time series (GTS) into a csv. It seems easy. Doing this exercise is the best way to measure the gap between a time series database and Excel!

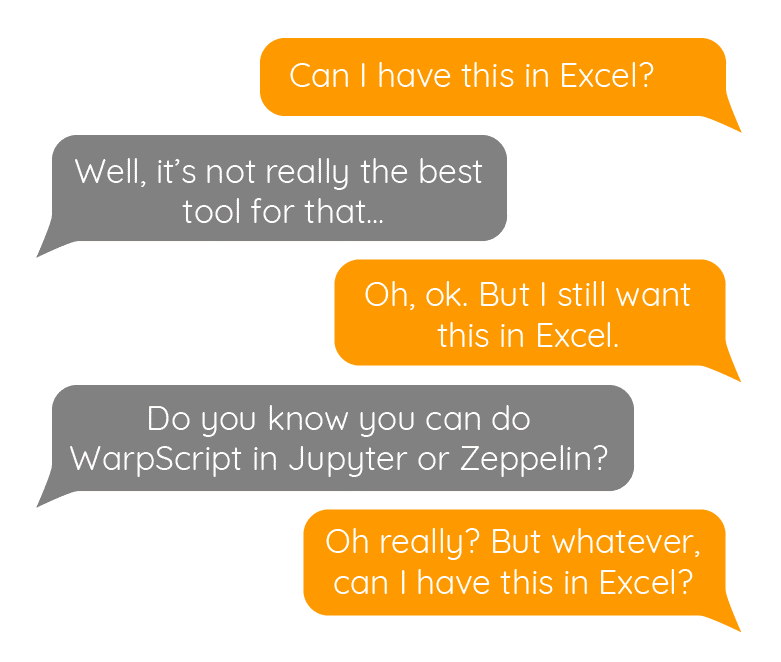
Who never lived in this situation… A colleague needs data, but he hasn't any basics of WarpScript, and the only tool he masters is Excel. So, he asked you to extract some GTS in a CSV file.
OK. Fine. Just ask him the sampling period he wants, considering Excel limits. 1s sampling rate for one month of data will output 2.6 million lines, Excel will suffer.
| Learn more about WarpScript. |
Data alignement
Time series timestamps are rarely aligned. That's all the purpose of a time series database like Warp 10. A timestamp is stored for each data.
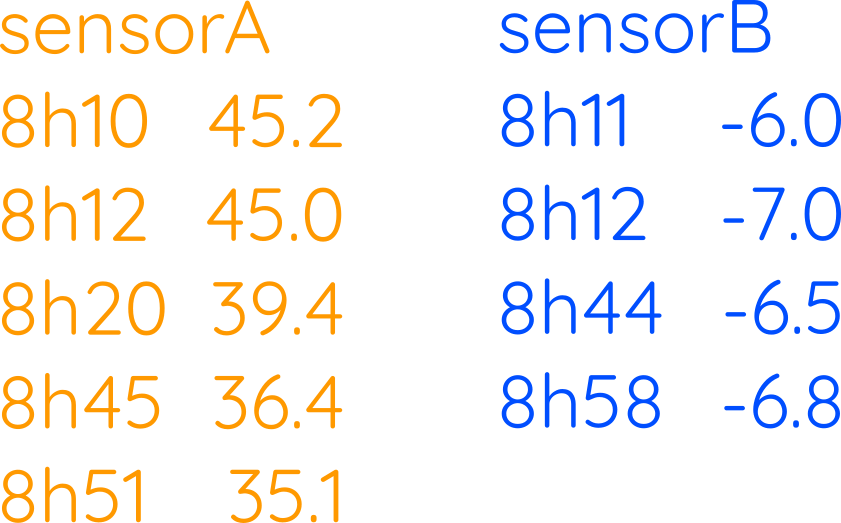
Lots of tools will regenerate a table to process this. Storing tables for time series is, of course, a huge memory waste. That is exactly what we are going to do for your colleague. Because tables were never designed to store multiple time series!

First thing first, we need to align data. The BUCKETIZE framework will help you. The bucket span will be one minute. The last bucket will be the most recent timestamp (the max of LASTTICK of each series). The bucket count will depend on the first point (the min of FIRSTTICK of each series).
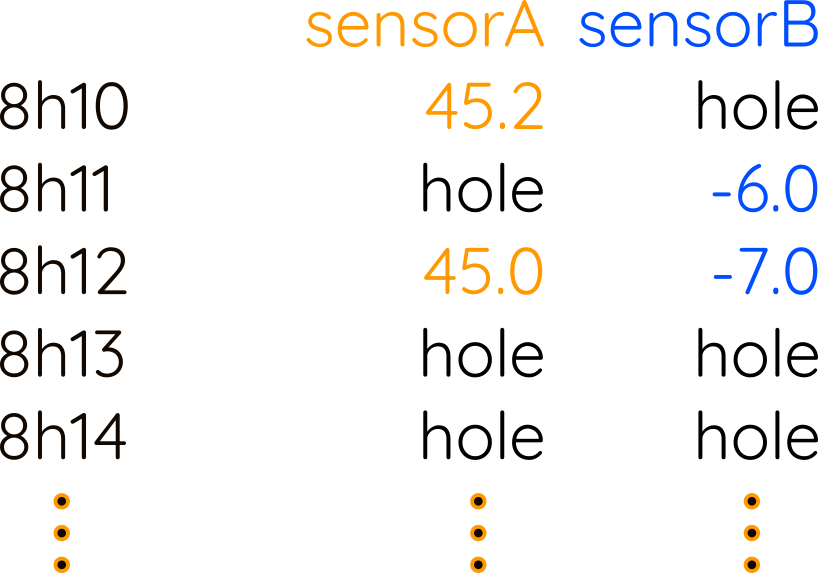
After this step, you won't see any visible difference, because the input was already aligned to the minute. BUCKETIZE did not invent data, it just creates one invisible hole every minute. If there is already one or several values in this minute, it takes the last one found (bucketizer.last).
Data interpolation
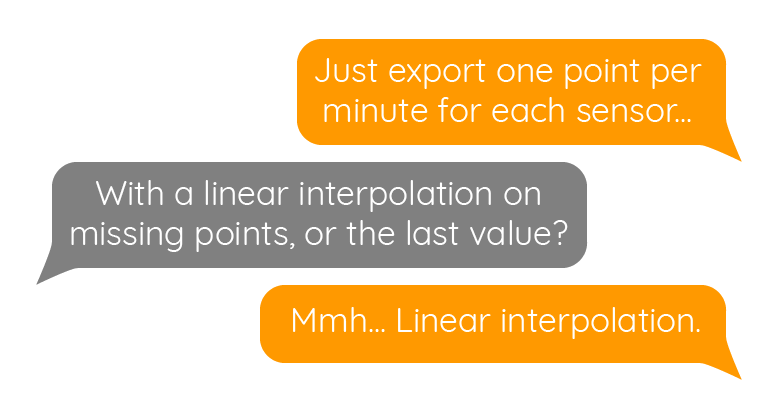
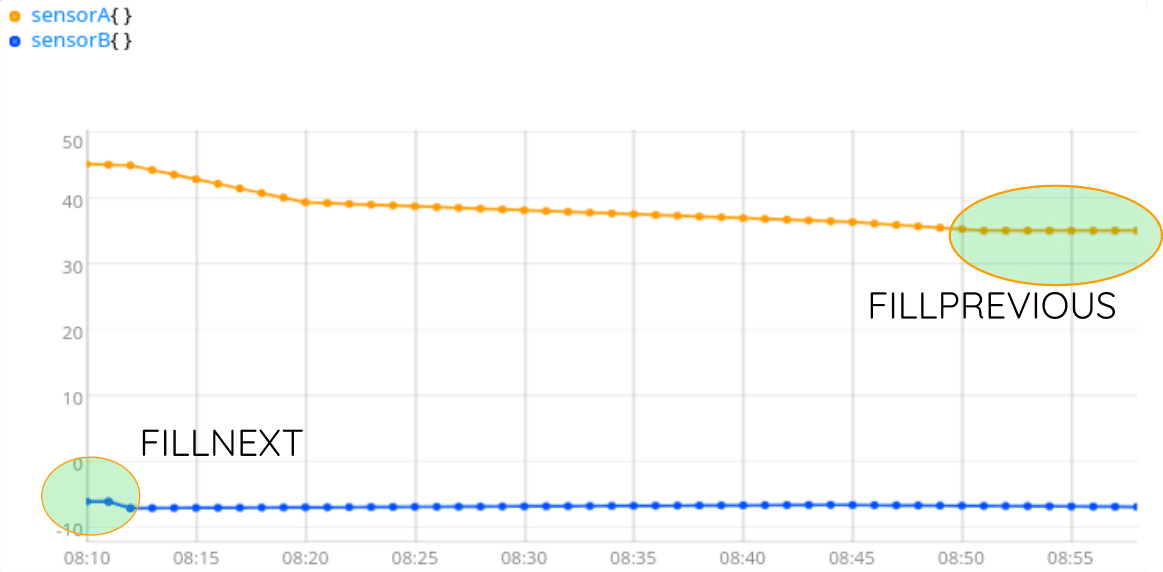
Your colleague prefers to have a linear interpolation. INTERPOLATE will do the job. But… What about the beginning and the end?
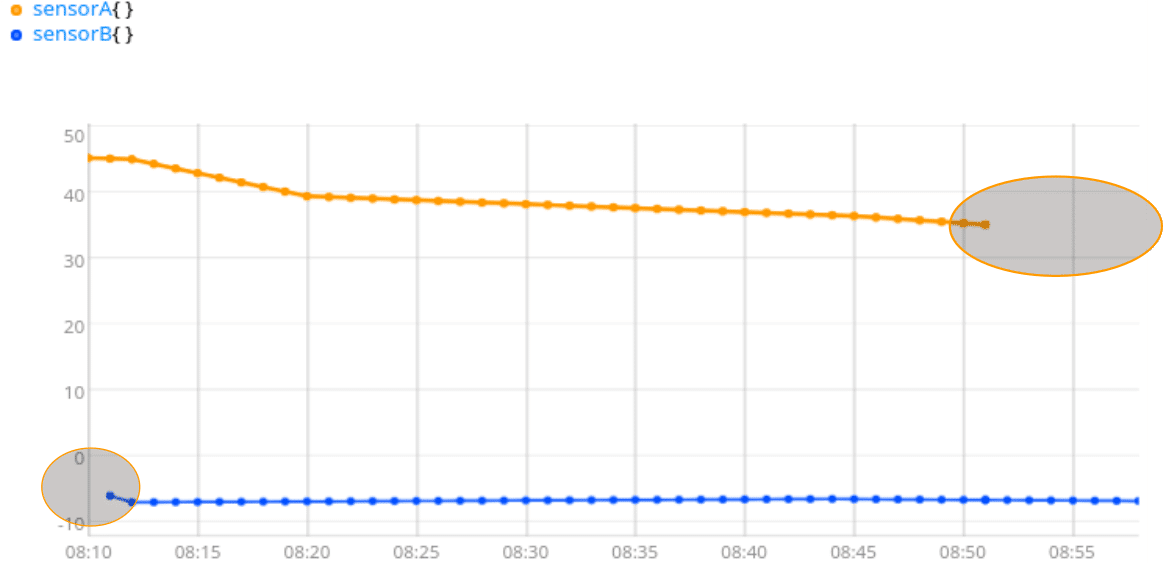
You need something here, to be able to transpose columns to lines easily. Because CSV libraries expect lines with one value per column, the most simple is to have values everywhere, then transpose. You can fill empty holes with 0, for example: [ NaN NaN NaN 0 ] FILLVALUE. Or you can just keep the closest value, with FILLNEXT and FILLPREVIOUS.
At this step, we have series with exactly the same timestamps, the same number of values, values defined everywhere. But most CSV libraries expect lines of data, so we need to build a table with lines, and column names…
[ [ "time" "sensorA" "sensorB" ] [ 8h10 45.2 -6.0 ] [ 8h11 45.2 -6.0 ]]
By the way, Excel does support ISO8601 notation, with millisecond precision.
Headers and transposition
I will first sort my GTS list by GTS classname, then build a column title line:
Then I will take the timestamps of the first GTS (because we are 100% sure that every GTS in the list has common timestamps), and convert them to something Excel understand (ISO8601), and add every VALUES list of all GTS:
I still have columns in memory, not lines:
[ [ "8h10" "8h11" "8h12" "8h13" ... ] [ 45.2 45.1 45.0 44.3 .... ] [ -6.0 -6.0 -7.0 -6.98 .... ]]
Transposition is done with the ZIP function, and the result is appended to the column title we already stored. The full WarpScript is:
The output is a JSON that can be passed to any CSV library easily.
JSON to CSV, python example
Believe me, you really don't want to handle yourself CSV for Excel tricks and traps. Especially if you have multi-line strings in your data, for example.
Once your WarpScript is ready, you can do a small Python program to launch the WarpScript, process the result, and save the CSV to your disk:
import csv
import jsonimport
requestswarpscript = """
  FETCH your data...
  interpolate, fill, transpose...
"""

url = "https://warp.senx.io/api/v0/exec"
print("request data...")
rawresult = requests.post(url, data=warpscript).text
print("parse json...")
j = json.loads(rawresult)
print(str(len(j[0])) + " lines. generating the csv…")
filename = "data for Excelman.csv"
out = open(filename, mode="w")
f = csv.writer(out, dialect="excel")
for row in j[0]:
  f.writerow(row)out.close()
Of course, you have to take into account regional specificities. For example, in the French version of Excel, columns are separated with a semi-column ; and decimal separator is a comma instead of a dot!
| What are the 4 stages of maturity of Industry 4.0? |
Conclusion
The task seems easy, but it really depends on the data, on the Excel version, which also depends on regional settings… That's why there is no generic function to create CSV from Geo Time Series within Warp 10.
For each use case, start with this basic example and adapt it to your use case.
If you need more help, contact us by email or on Stack Overflow. SenX also provides professional WarpScript support and competitive SaaS services to host your precious time series.
Read more
Create a custom tile for Discovery
Discovery Explorer - The dashboards server
WarpScript in Jupyter notebooks

Electronics engineer, fond of computer science, embedded solution developer.