Measure precisely your domestic fuel consumption with an ESP8266 and Warp 10 time series database. Simple and reliable.
If you have an old house, good chances there is still an oil-fired burner to produce heat and hot water. Heating oil price is high and still rising, and you may ask you to switch to another energy source (for example, air/air heat pump system). In order to dimension your new energy source, you need to measure your home heating oil consumption precisely. That is the point of this article.
Once you know how many liters per day you consume, you can compute:
- The equivalent in kwh for a month.
- The peak power you need in winter.
The first solution is to look closely at the tank fuel level needle each day… But it won't be precise. Better using Warp 10.
Understand fuel burners
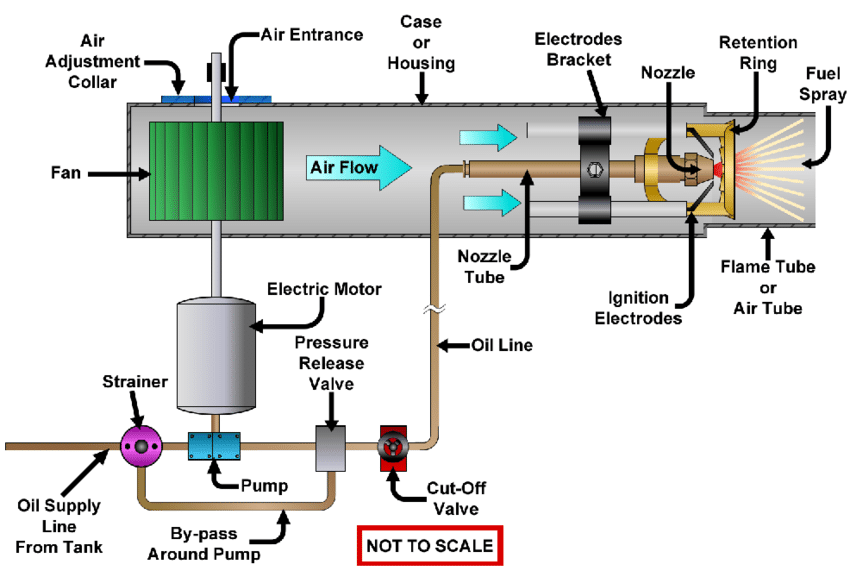
Fuel burning is simple. Really. You need a good mix of air and fuel. Your oil burner is optimized for one operating point, there is no modulation at all… Once the flame is lit, the power is constant.
To measure the amount of fuel burned, you must know the nozzle datasheet. Fortunately, it is written on it:
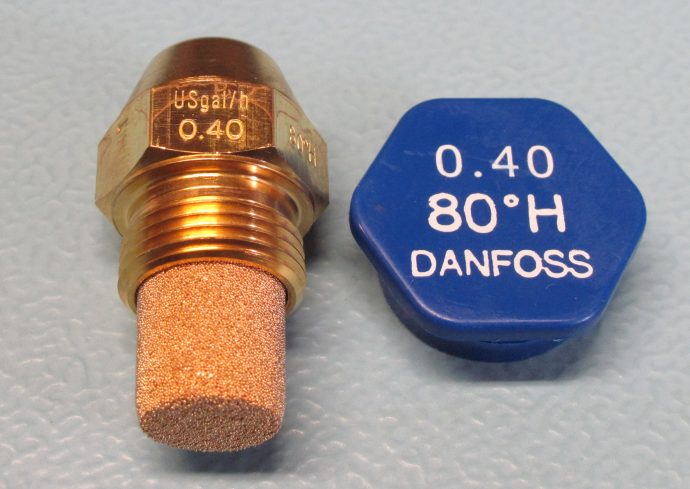
80° H describes the form of the fuel droplets "cloud". 0.40 is the flow in USgal/h. So, for my burner, consumption is 0.4 USgal/h, 1.514 L/h. But this depends on the pump pressure and the fuel type, so Danfoss provides a spreadsheet to convert this with European heating oil or UK kerosene.
The burner maker should also provide you a table similar to this one:
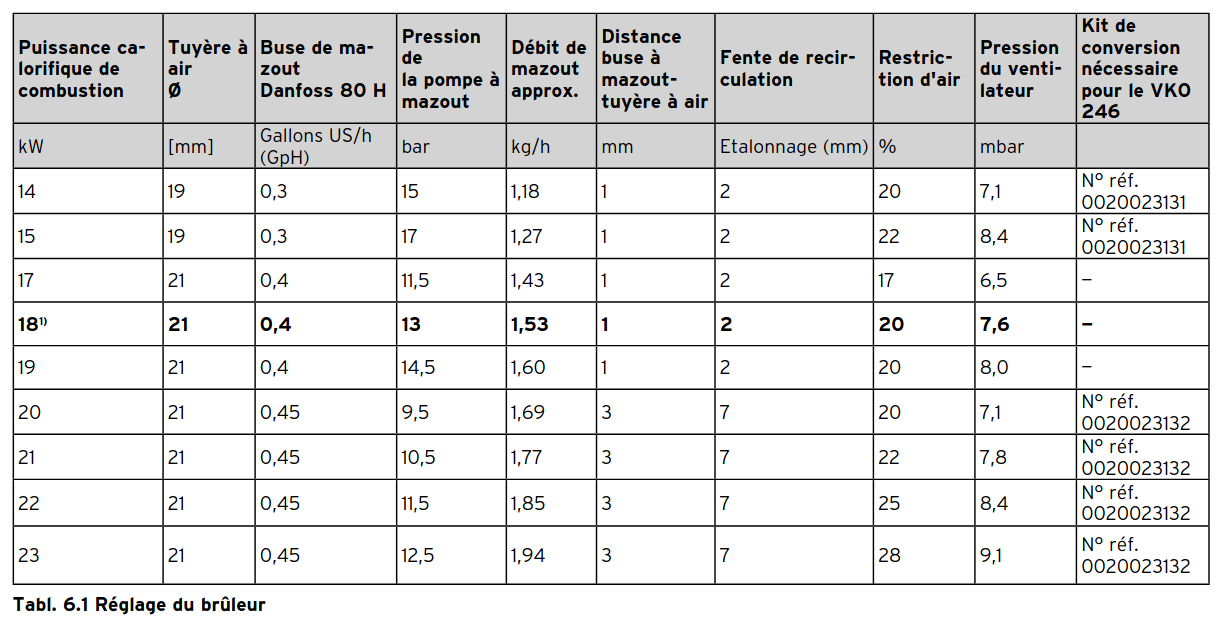
This table does not exactly match the danfoss spreadsheet (18kW is at 11 bar), but as the density is around 0.85kg/L, we will take 1.8L/hour as a reference. (10kWh per liter is a well known reference too).
Next step is to measure when exactly does the cut-off valve opens and close.
Hardware
First, locate the cut-off valve solenoid: it is close to the pump, or maybe on the pump, and it looks like that:

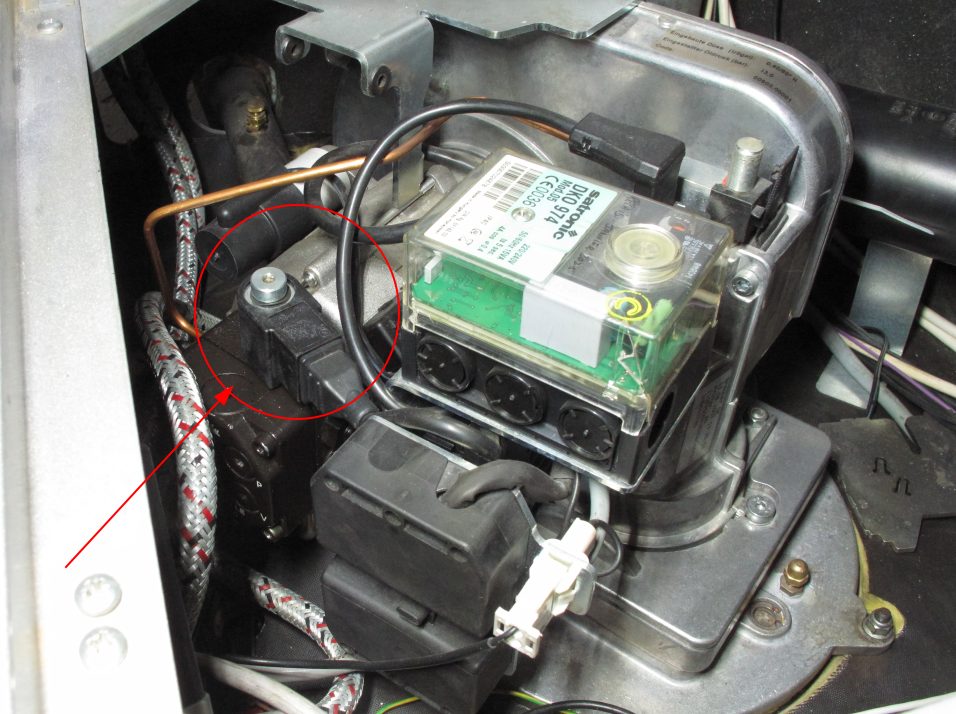
This is a 220V coil, often driven by a relay in the burner controller.
My burner is in the Wi-Fi range, so I will use an ESP8266 to send the coil data.

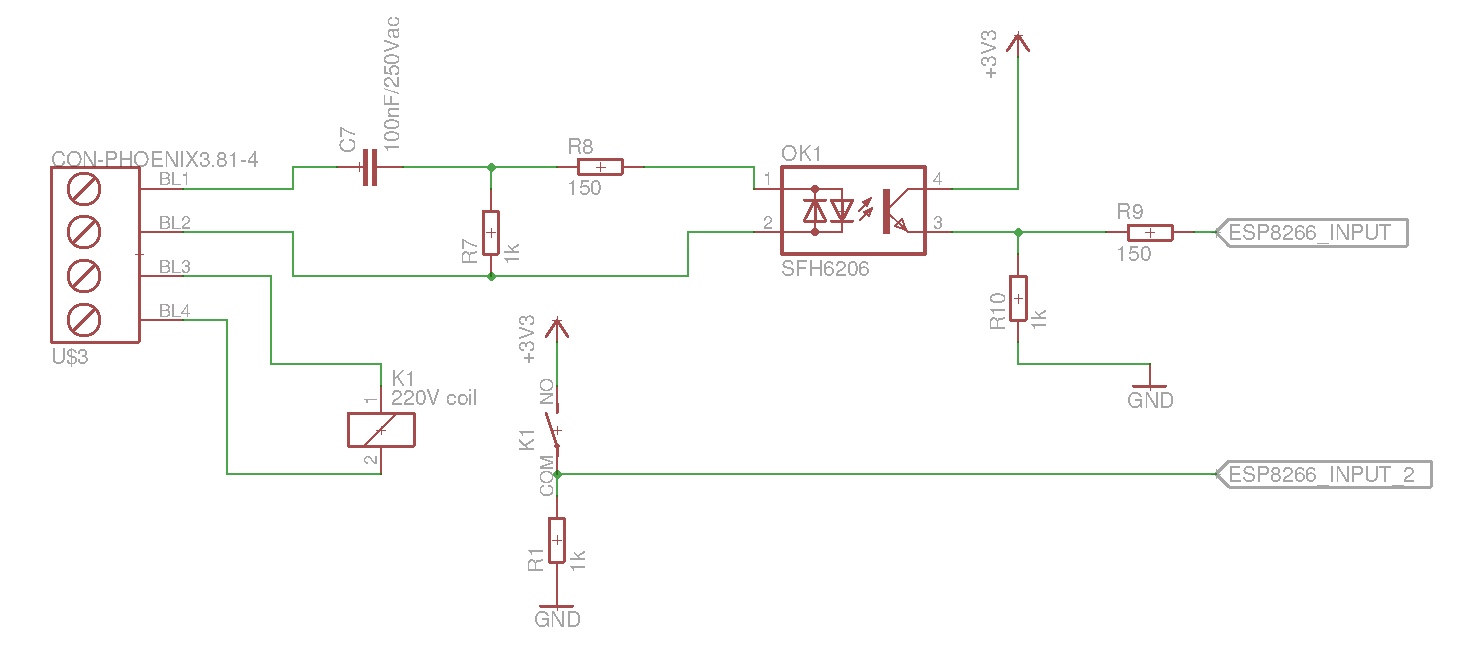
First step, you need to interface the 220V coil with the ESP8266. Two solutions to do so:
- Use a 220V coil relay (easiest)
- Use an optocoupler
Here is an example for both solutions:
On my burner, I also added an auto reset function: when something goes wrong (for example, old spark plug), the burner controller stops and waits endlessly for a push on the reset button + power cycle. To automate this and keep retrying once every hour, you need to:
- Read the failure status (220v driven neon bulb, just like the valve coil)
- Read the cut-off valve status
- Add a relay in parallel to the push button
- Add a normally closed relay to power cycle all the system
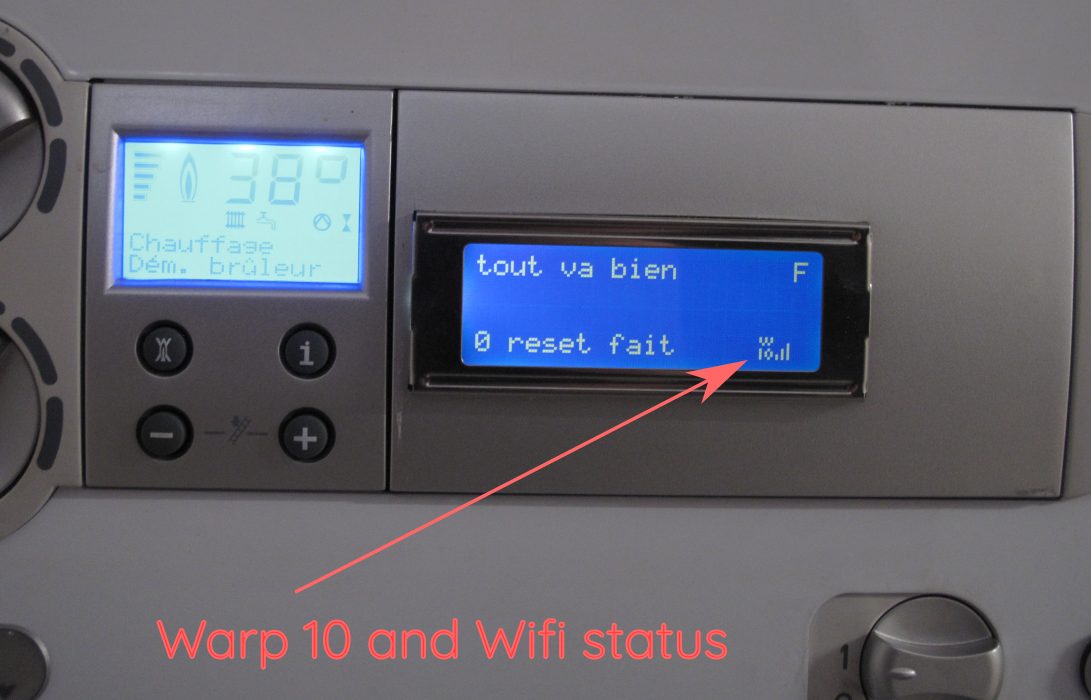
Optionally, you can also add an LCD screen. Here is my burner setup:
Embedded Software
I am in the case of the "low spec hardware without RTC", described here in the Warp 10 documentation for industrial IoT suppliers.
So, I will send data without any timestamp to a local Warp 10 on the LAN.
First, set up an environment for ESP8266 development. I use PlatformIO VS Code extension. In platformio.ini, you can fix terminal baud rate, and speed up the upload speed:
; PlatformIO Project Configuration File
;

[env:huzzah]
platform = espressif8266
board = huzzah
framework = arduino
lib_deps =
	arduino-libraries/LiquidCrystal@^1.0.7
monitor_speed = 115200
upload_speed = 921600
upload_port = /dev/ttyUSB0
In the initialization step (void setup()), set up the Wi-Fi and all the input output you need:
#include <ESP8266WiFi.h>
#include <LiquidCrystal.h>

const char *ssid = "ceiling";
const char *password = "xxx123456";
#define PIN_BURNER_EV_FUEL 3 // input. fuel injector

void setup() {
  pinMode(PIN_BURNER_EV_FUEL, INPUT_PULLUP);
  WiFi.mode(WIFI_STA);
  WiFi.begin(ssid, password);
  /* .... screen management, if any */
}
ESP8266 Wi-Fi lib will handle disconnection and retries. You don't have to deal with that in your main loop. In the main loop, implement a state machine to monitor the cut-off valve status. You need to record one point every time the cut-off valve status changes, and one every 10 minutes (heartbeat to check that your system is alive).
For simplicity, I did not use external libraries to send data to Warp 10, I just craft an HTTP request to the /api/v0/update endpoint. Here is the code to send a request:
WiFiClient client;
IPAddress warpServer = IPAddress(192, 168, 1, 4);
const int warpServerPort = 8080;

int sendWarp10Update(IPAddress warp10Host, int warp10Port,
                     const String &writeToken, const String &classname,
                     const String &labels, String value) {
  // connect to server
  client.connect(warp10Host, warp10Port);
  if (!client.connected()) {
    return 1; // early exit if cannot connect
  }
  // build body of http request : just one line, no timestamp.
  String httpBody = String("// ") + classname + labels;
  httpBody = httpBody + " " + value + "\n";

  // build headers of http request
  String httpHeaders = String("POST /api/v0/update HTTP/1.1\n");
  httpHeaders = httpHeaders + "Host: " + warp10Host.toString() + ":" + warp10Port + "\n";
  httpHeaders += "Accept: */*\n";
  httpHeaders = httpHeaders + "X-Warp10-Token: " + writeToken + "\n";
  httpHeaders += "Connection: close\n";
  httpHeaders += "Content-Type: text/plain \n";
  httpHeaders = httpHeaders + "Content-Length: " + httpBody.length();

  // send the request
  client.println(httpHeaders);
  client.println("");
  client.println(httpBody);
  client.stop();
  return 0;
}
And every 10 minutes, or on state change, I will send the cut-off valve status:
String tokenW =
    "D1D7KB3E0v4JgkQ_SnXVJyTXwMxMeSb8lISDpARzkQVyF3_"
    "FP6bjv02jhXCwY8WLDB2EMaQwweR44u.tGeQyJNmp32zeNtXa1.7SuTMjUkx_4VKKLhquf3..";

int sendStatusToWarp10(void) {
  int r = 0;
  r = sendWarp10Update(warpServer, warpServerPort, tokenW, "vaillant.burner.on",
                       "{}",
                       digitalRead(PIN_BURNER_EV_FUEL) == LOW ? "T" : "F");
  return r;
}
Note that I explicitly ask Warp 10 to close the TCP socket, by adding the Connection: close header. The request only contains one line, with one boolean GTS.

One winter month later… It is time to use the data!
WarpScript
To begin with, I will look for downtimes. As I send at least one datapoint every 10 minutes, the maximum time between each datapoint should be less than 10 minute. To plot this, you need two mappers:
{
  'token' $readToken
  'class' 'vaillant.burner.on'
  'labels' {}
  'end' NOW
  'count' 10000
} FETCH
[ SWAP mapper.tick 0 0 0 ] MAP
[ SWAP mapper.delta 1 0 0 ] MAP
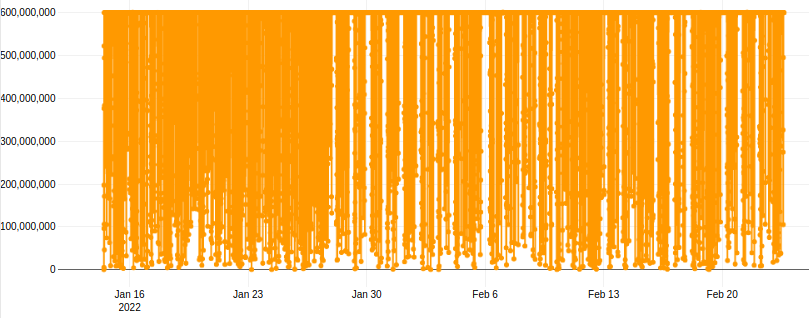
Delta between ticks is less than 600 millions microseconds. Nice, the system is reliable!
Next, I will transform the data to get a GTS with one point every time the cut-off valve closes, where the value will be the time spent opened. To do so, I will first compact the GTS to keep only changes:
{
  'token' $readToken
  'class' 'vaillant.burner.on'
  'labels' {}
  'end' NOW
  'count' 10000
} FETCH
COMPACT SORT 'gts' STORE

// long are easier to visualize than booleans
[ $gts mapper.tolong 0 0 0 ] MAP
To compute the "opened time", I need to write my own MACROMAPPER.
// the usual way, not precise
// compute a gts with on time at each falling edge
[ $gts
  <%
    'i' STORE
    $i 7 GET 0 GET 'previousValue' STORE
    $i 7 GET 1 GET 'currentValue' STORE
    $previousValue $currentValue ! && // falling edge
    <%
      [ 0 NaN NaN NaN
        $i 3 GET 1 GET
        $i 3 GET 0 GET -    // returns tick delta
      ]
    %>
    <%                                // rising edge
      [ 0 NaN NaN NaN NULL ] // return no datapoint
    %> IFTE
  %> MACROMAPPER 2 2 STRICTMAPPER
  1 0 0
] MAP
0 GET 1 h TODOUBLE /  // divide values by one hour
'on Time' RENAME
'onTimeGts' STORE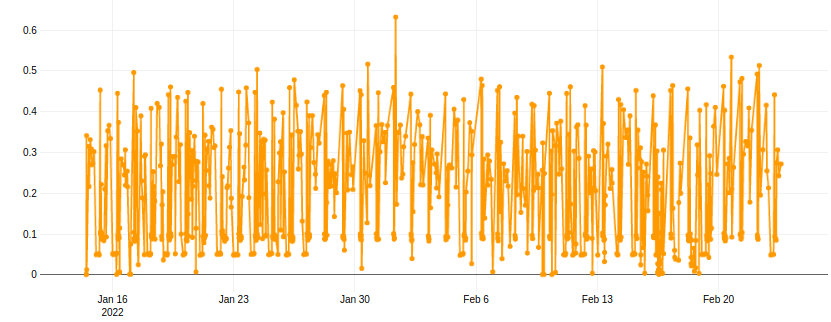
The maximum continuous burning time is 0.63 hours.
When the water is too hot, the burner stops, then starts again. That is the only way to modulate max power. Now we have this "on time" GTS, it is really easy to compute on time per hour, or per day, with BUCKETIZE.
Maximum Power
It is important to check that the burner power fits to the house needs. To do so, I will plot the number on hour burning per hour:
$gts LASTTICK ->TSELEMENTS 0 3 SUBLIST TSELEMENTS->  'lastHour' STORE
[ $onTimeGts bucketizer.sum $lastHour 1 h 0 ] BUCKETIZE
'Hour On per Hour' RENAME 
The maximum ratio is 0.8, and the average is 0.35. This burner power is high for the house. I do not need so much power, even in winter.
| Read more about how to connect a BeerTender® to Warp 10 using MQTT on LoRaWan with TheThingsNetwork |
Energy per day
$gts LASTTICK ->TSELEMENTS 0 2 SUBLIST TSELEMENTS->  'lastDay' STORE
[ $onTimeGts bucketizer.sum $lastDay 1 d 0 ] BUCKETIZE
0 GET $literPerHour *
'L per day' RENAME
When the external temperature is low, fuel consumption rises to 9 L / day. (280L /month… a lot)
It is time to transform this into kW and kWh. The power of the burner is 18kW. Computing the equivalent in pure electricity is straightforward, you just need to bucketize.sum the number of hour per month, and multiply by 18:
$gts LASTTICK ->TSELEMENTS 0 3 SUBLIST TSELEMENTS->  'lastHour' STORE
[ $onTimeGts bucketizer.sum $lastHour 1 h 0 ] BUCKETIZE
'kWh per month' RENAME
[ SWAP bucketizer.sum NOW 31 d 0 ] BUCKETIZE
0 GET 18.0 *
The result is 2100 kWh for the coldest month. Even if I assume the efficiency of the system is 90% (This is a condensing boiler), this is equivalent 1890kWh of pure electricity, that's a lot of energy. We can also use a heat pump with a ratio 3… this will cost 3 time less electricity. I can now compare solutions, with February 2022 energy prices in France:
| kWh/month | L/month | € /month | |
| domestic oil | 2100 | 210 | 248 |
| pure electric | 1890 | 283 | |
| heat pump | 630 | 94.5 |
Conclusion
The all point was to measure precisely how much time an electrovalve remains opened.
Pushing data into Warp 10 is really easy with any small Wi-Fi hardware, such as ESP8266 or ESP32. Crafting an HTTP request yourself on a TCP socket is easy and remains a good practical exercise for all students!
As explained in Warp 10 documentation for industrial IoT, I use an intermediate Warp 10 server to timestamp data, and I store state change + heartbeat in the same GTS. Using COMPACT and a simple mapper, I compute an intermediate GTS that store the time spent at true at each falling edge. With this intermediate GTS, aggregation per hour or per month is straightforward with BUCKETIZE framework and bucketizer.sum. If you need a precise month bucket, you can use calendar buckets as described in this article.
Thanks to Warp 10, I can wisely choose to spent 10k€ or not in a heat pump system!
Read more
Plug Warp 10 to Apache Nifi to manage your dataflow pipelines
Warp 10 for IoT: GDPR compliant before GDPR even existed
FETCHez la data !

Electronics engineer, fond of computer science, embedded solution developer.