Introduction to the Warp 10 Trace Plugin, a dedicated WarpScript code debugger that will save you up to 90% of your debugging time.

WarpScript is powerful and allows simple to advanced scripts. And with WarpScript as with most languages, the debugging part is a real pain! We've had a code debugger project for a while, it's finally ready!
What if there was an easier way to debug your code?
According to our personal experience at SenX and after questioning some of our customers and partners, we arrive at an average of 10 to 15% of the time spent debugging our code each month (WarpScript or not).
So if we take the example of a small team made up of two developers, they spend on average 34 to 51 hours debugging their code. This means between 4 and 6 days a month during which the team is stuck on the progress of the current project. That’s a lot of time that could be more productive!
Yes, debugging is the first thing we present in our tutorials, to help you be more efficient. But it is still hard because you cannot see the context when your request fails…
So, we needed a code debugger. A fully-fledged one, with breakpoints, variable watchers, step-by-step execution, error catching…
All the features that save a lot of time for beginners and experts alike!
And… here is the Trace Plugin. 🙌
Understand, optimize, and perfect your code
The Trace Plugin brings the ability to trace and profile WarpScript code execution (on WarpStudio or VSCode), saving you up to 90% of your debugging time.
- Improve code understanding with advanced debugging features.
- Optimize performance and facilitate the identification of critical areas of your code.
- Considerable productivity gains for the whole team. Developers spend less time debugging their code and more time on project progress.
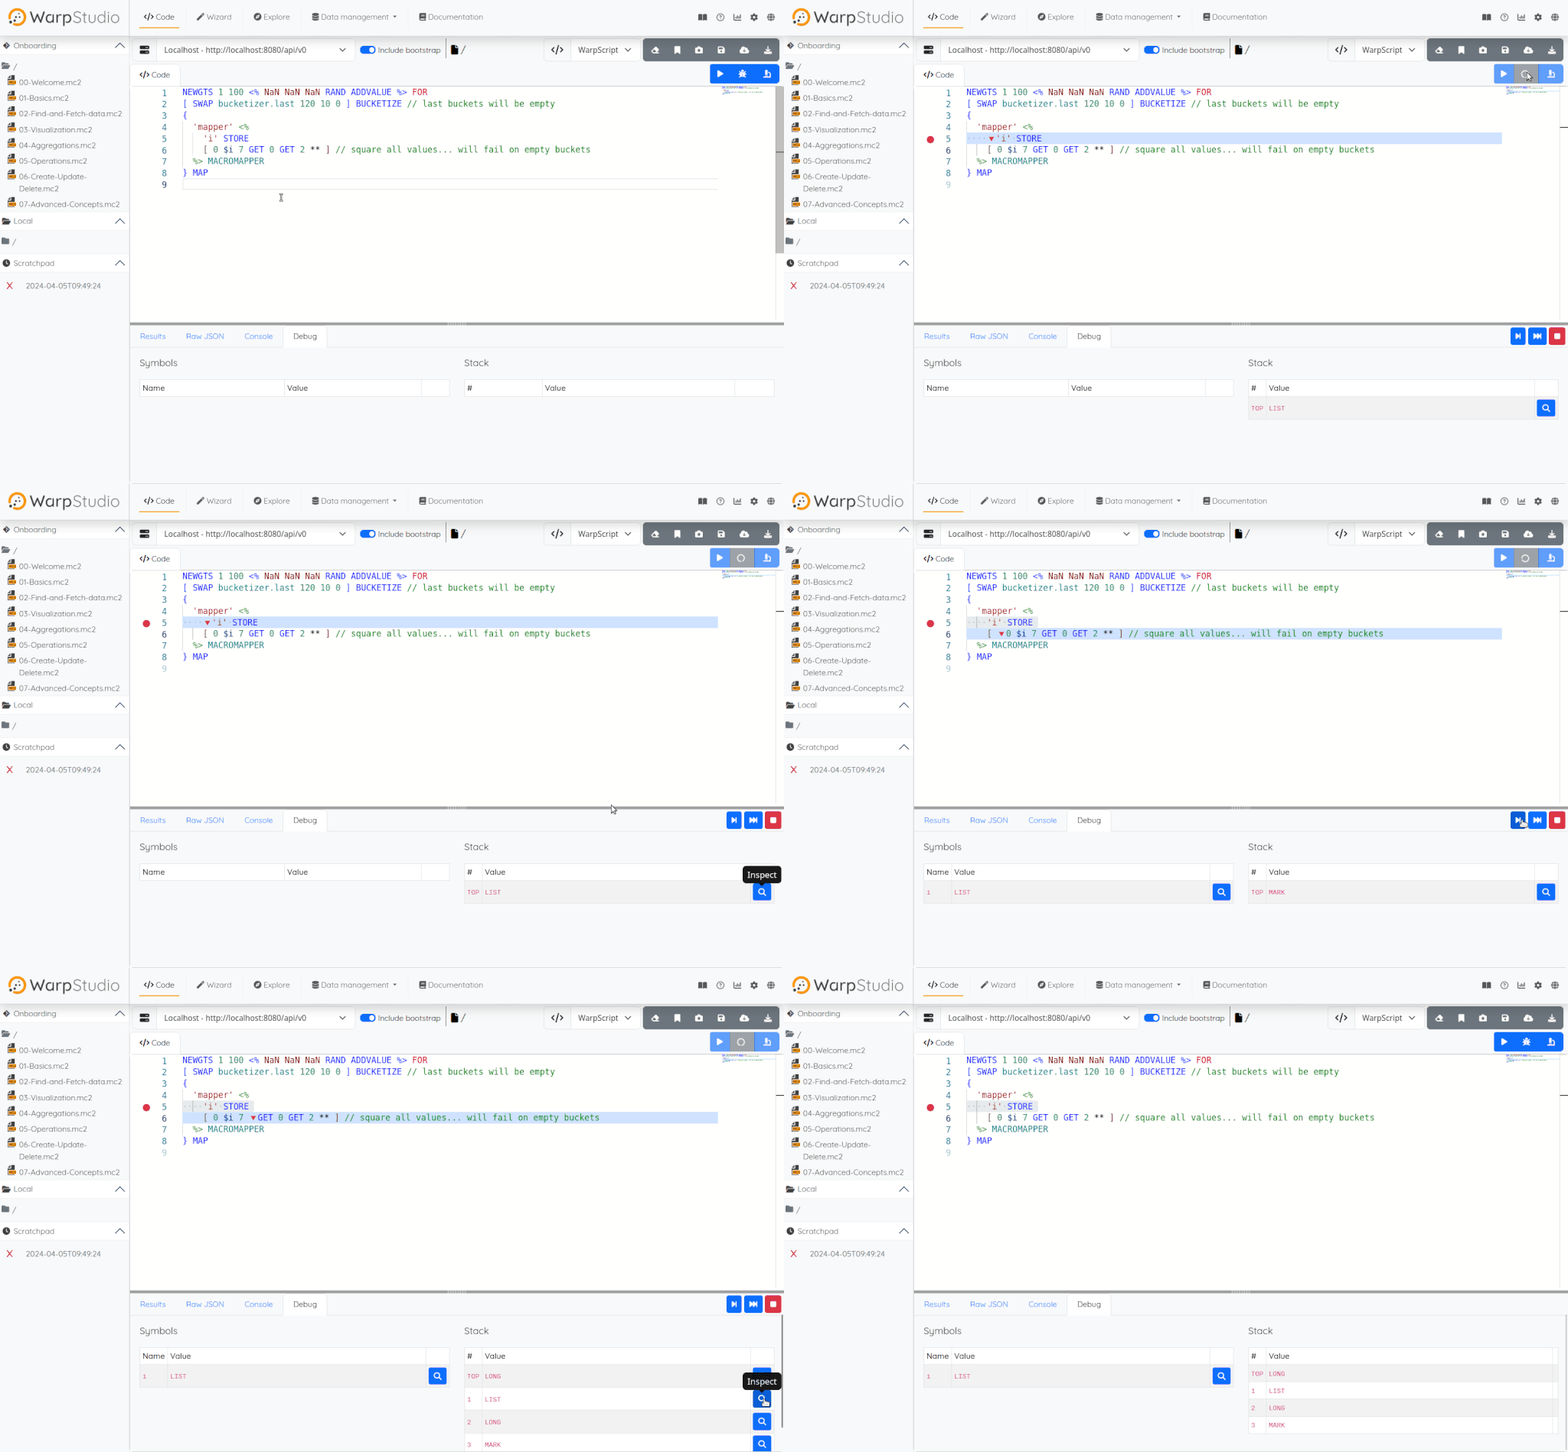
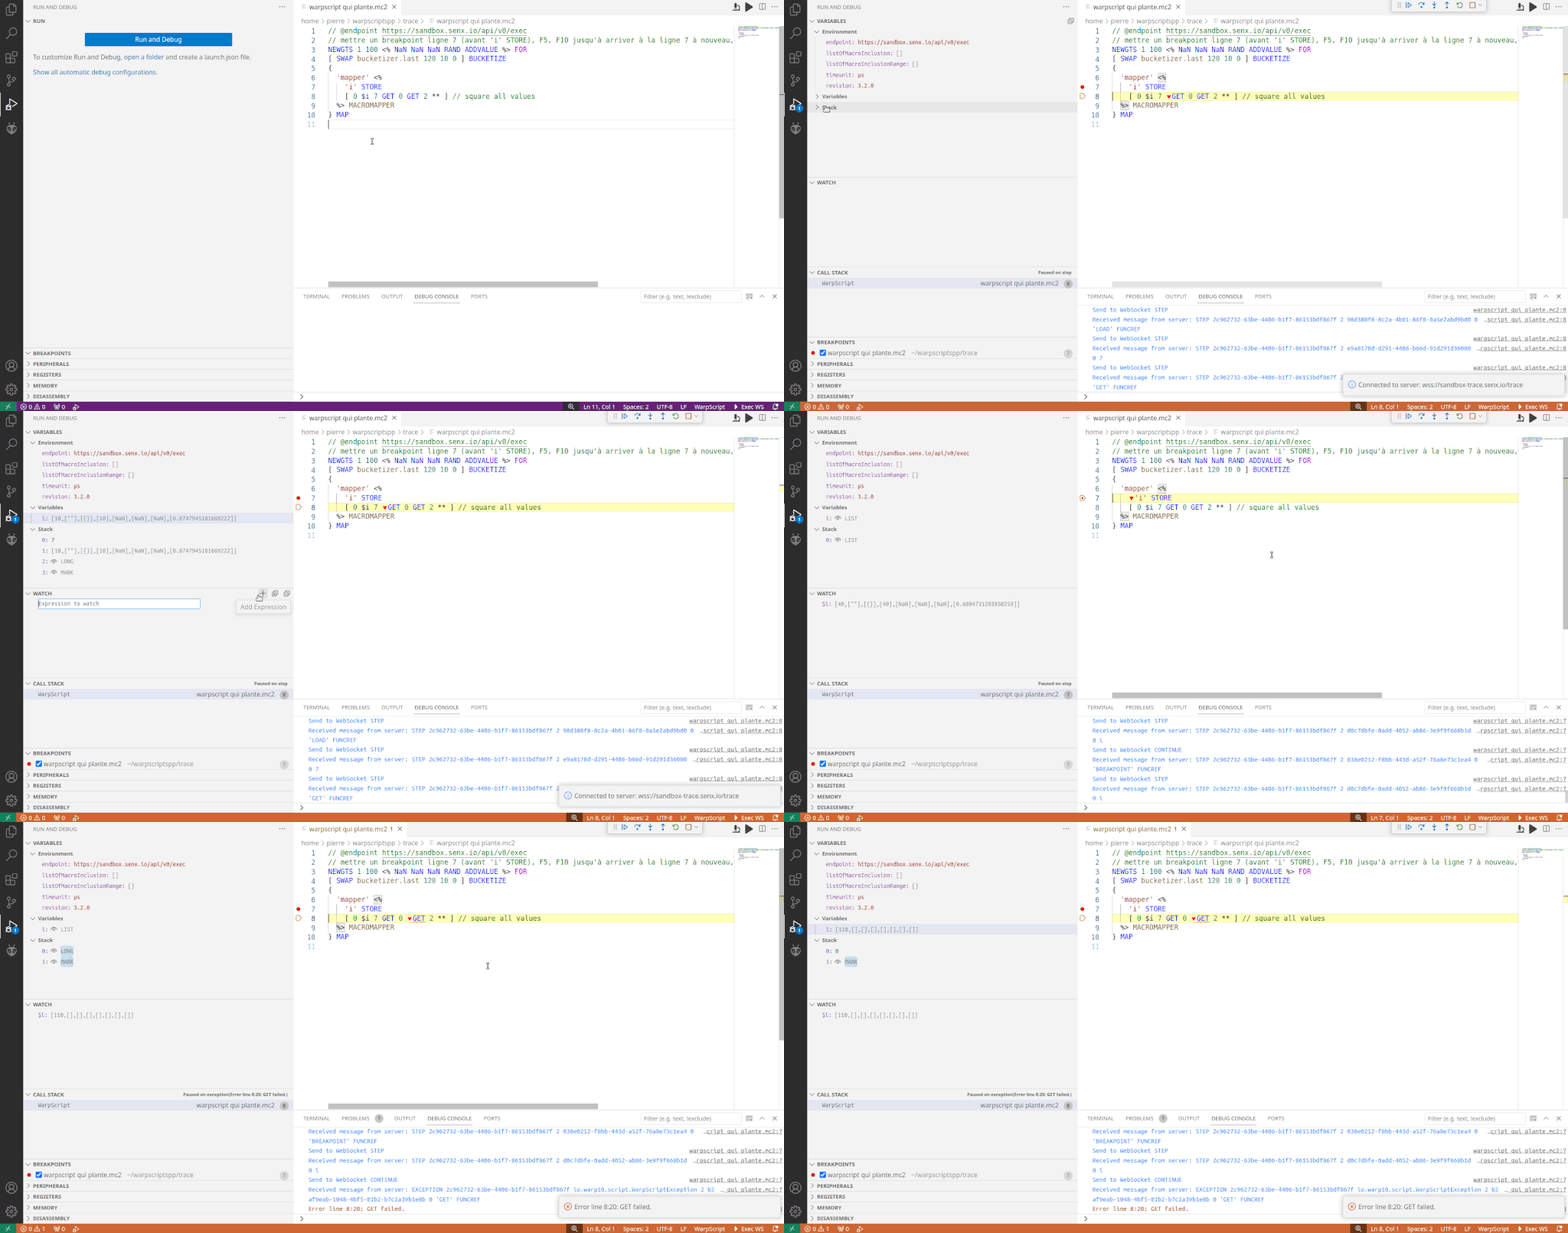
Here's what it looks like in WarpStudio and VSCode:

Try the Trace Plugin!
If I've struck a chord by talking about the time spent debugging your code, you can test the new debugger with the Sandbox.
All the Sandbox-generated tokens have the capability to use the code debugger. You just need 5 minutes to configure your favorite WarpScript editor:
As you may already have guessed, the debugger access rights are managed with a token capability. By default, the Sandbox debugger is limited to 100 statements and 10 parallel debug sessions.
I want this feature now!
The WarpScript debugger is:
- a real time saver for your team
- a resources saver: the included profiler will help you optimize your requests
- a marvelous WarpScript learning tool
- the first and only time series database query language fully fledged debugger!
The Trace Plugin the WarpScript debugger depends on is not open source, you need a license to benefit from this new feature.
The good news is the Trace Plugin license is now included by default in some support contracts, so you may already have access to it without knowing it…
Please contact us or join us on the Warp 10 lounge to learn more about our licenses (such as test, standard, and student licenses).
Read more
Interacting with QuestDB in WarpScript through JDBC
Leveraging WarpScript from Pig to analyze your time series
WarpStudio 2.0.6

Electronics engineer, fond of computer science, embedded solution developer.
