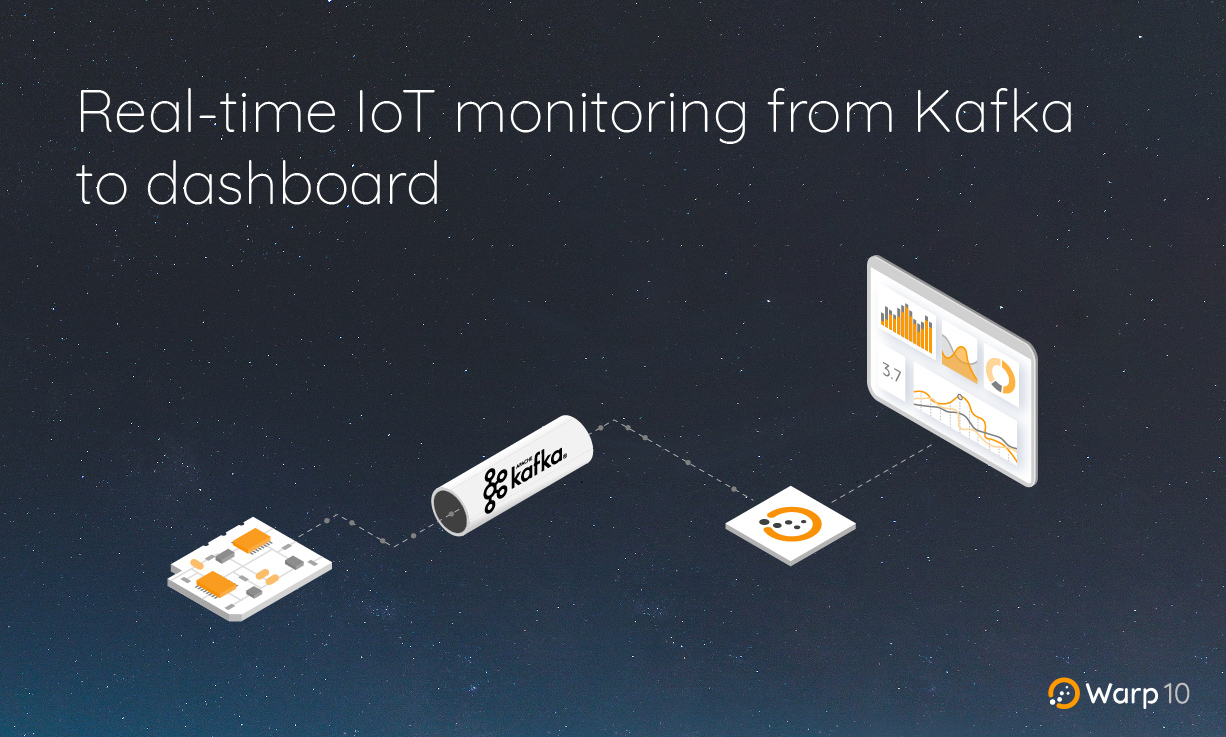
Build a real-time system monitoring using a Kafka broker and a dashboard using WebSockets. Here is a complete tutorial covering warp10-kafka-plugin, the Warp 10 accelerator feature and a Discovery dashboard.
By following this tutorial, you will be able to handle our Kafka plugin, the Warp 10 accelerator, and Web-sockets usage within Discovery dashboards.
Here are the steps:
In this tutorial we will assume that your computer IP is
192.168.1.1(you can useipconfigon Windows orifconfigon Linux to grab your own IP).
Start a local Kafka broker
For convenience, we will use Docker images and a docker-compose file to start our broker. Of course, do not use that in production. it is just for test purposes.
Create a file named docker-compose.yml (customize with your IP address):
---
version: '3'
services:
  zookeeper:
    image: confluentinc/cp-zookeeper:7.3.2
    container_name: zookeeper
    environment:
      ZOOKEEPER_CLIENT_PORT: 2181
      ZOOKEEPER_TICK_TIME: 2000

  broker:
    image: confluentinc/cp-kafka:7.3.2
    container_name: broker
    ports:
    # To learn about configuring Kafka for access across networks see
    # https://www.confluent.io/blog/kafka-client-cannot-connect-to-broker-on-aws-on-docker-etc/
      - "0.0.0.0:9092:9092"
    depends_on:
      - zookeeper
    environment:
      KAFKA_BROKER_ID: 1
      KAFKA_ZOOKEEPER_CONNECT: 'zookeeper:2181'
      KAFKA_LISTENER_SECURITY_PROTOCOL_MAP: PLAINTEXT:PLAINTEXT,PLAINTEXT_INTERNAL:PLAINTEXT
      KAFKA_ADVERTISED_LISTENERS: PLAINTEXT://192.168.1.1:9092,PLAINTEXT_INTERNAL://broker:29092
      KAFKA_OFFSETS_TOPIC_REPLICATION_FACTOR: 1
      KAFKA_AUTO_CREATE_TOPICS_ENABLE: 'true'
      KAFKA_CREATE_TOPICS: order-topic:3:1
      KAFKA_TRANSACTION_STATE_LOG_MIN_ISR: 1
      KAFKA_TRANSACTION_STATE_LOG_REPLICATION_FACTOR: 1
and start it with:
$ docker-compose upThe Kafka broker is up and running.
Start and configure a local Warp 10 instance
Also for convenience, we will use our Docker image. In this tutorial, we use a persistent volume in /opt/warp10_3.0 on our local computer.
$ sudo mkdir /opt/warp10_3.0
$ docker run -d -p 8080:8080 -v /opt/warp10_3.0:/data --name warp10 warp10io/warp10:3.0.0-ubuntu
Warp 10 is up and running.
Tokens generation
$ docker exec warp10 ./bin/warp10.sh tokengen tokens/demo-tokengen.mc2You should get a result like this:
[{
  "ident" : "4f8c4edc7a42d112",
  "id" : "DemoWriteToken",
  "token" : "hQfwWAHcJpHBHgpz2531HtcKAknSzpam6XzbfMcwBvaDZLZM6uWDD2xNF8kGUitE5UzUEWpSdYQQXUQ8VQZc.De9kpFaERFMvbYxD7btd2i6UnyzfTni1F"
},{
  "ident" : "5d99a69053407ad2",
  "id" : "DemoReadToken",
  "token" : "Lj.suW2XZru53seb.y7QulvE_qJ4CyMMEfaz6T.ozaBx79RJ1m1m_c.Bj7.jEGlM2C7MRlSCpKgaCwVXEen6nZOo9KgbC5IakZTc5RvZ3qZX_mq_VXm9vNkANB5J7uWJExgGK6Ht9kAL1W_1tBR1Dl2H9XJiWXKCmz3pYxJv7p7"
}]Now, we have to install our Kafka plugin.
For convenience, we have to change the permissions of the /opt/warp10_3.0/warp10 directory. Do not do this in production. The user id inside the docker image for warp 10 is 942. You can also create a local user with the same UID.
$ sudo chmod -R a+rwx /opt/warp10_3.0/warp10
$ sudo useradd warp10_docker -u 942 -s /bin/bash
Kafka plugin
You can do this manually or take advantage of our WarpFleet Repository mechanism.
The WarpFleet way
First, you need Gradle on your computer.
| Read more about the WarpFleet Gradle plugin |
In /opt/warp10_3.0/warp10, create a file named build.gradle:
buildscript {
    repositories {
    mavenCentral()
        mavenLocal()
    }
    dependencies {
        classpath 'io.warp10:warpfleet-gradle-plugin:0.0.3'
    }
}

apply plugin: 'io.warp10.warpfleet-gradle-plugin'

warpfleet {
  packages = 'io.warp10:warp10-plugin-kafka'
  warp10Dir = '/opt/warp10_3.0/warp10'
}
And run:
$ cd /opt/warp10_3.0/warp10
$ gradle wrapper
$ ./gradlew wfInstall
Starting a Gradle Daemon, 2 incompatible and 1 stopped Daemons could not be reused, use --status for details

> Task :wfInstall
○ Retrieving io.warp10:warp10-plugin-kafka:1.0.1-uberjar info
○ Installing io.warp10:warp10-plugin-kafka:1.0.1-uberjar into: /opt/warp10_3.0/warp10
○ Retrieving: io.warp10-warp10-plugin-kafka-1.0.1-uberjar.jar
✔ io.warp10-warp10-plugin-kafka-1.0.1-uberjar.jar retrieved
○ Calculating dependencies
○ Installing dependencies:NG [8s]
✔ Dependency: io.warp10-warp10-plugin-kafka-1.0.1-uberjar.jar successfully deployed
○ Calculating properties
⚠ No configuration found, do not forget to add 'warpscript.plugins.xxx = package.class'
✔ io.warp10:warp10-plugin-kafka:1.0.1-uberjar installed successfully.
Do not forget to check the configuration file: /opt/warp10_3.0/warp10/etc/conf.d/99-io.warp10-warp10-plugin-kafka.conf

BUILD SUCCESSFUL in 9s
1 actionable task: 1 executed
As it is said, we have to configure the plugin in /opt/warp10_3.0/warp10/etc/conf.d/99-io.warp10-warp10-plugin-kafka.conf, we will do that later.
The manual way
This is a less fun way to install an extension or a plugin. Plugins or extensions may need jar dependencies you will have to handle by yourself. Luckily, the Kafka plugin does not need such dependencies.
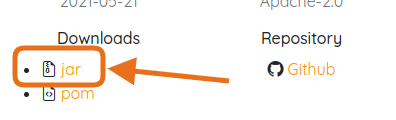
Download the Kafka plugin jar in /opt/warp10_3.0/warp10/lib, you can find the link here.
Create an empty file named 99-io.warp10-warp10-plugin-kafka.conf in /opt/warp10_3.0/warp10/etc/conf.d:
Kafka Plugin configuration
Create a new directory with the same user and rights as the others:
$ mkdir /opt/warp10_3.0/warp10/kafka
$ sudo chmod -R a+xrw /opt/warp10_3.0/warp10/kafka
Edit /opt/warp10_3.0/warp10/etc/conf.d/99-io.warp10-warp10-plugin-kafka.conf:
# -------------------------------------------------------------------------------------
# io.warp10:warp10-plugin-kafka:1.0.1-uberjar
# -------------------------------------------------------------------------------------

kafka.dir=/data/warp10/kafka
kafka.period=1000
warp10.plugin.kafka = io.warp10.plugins.kafka.KafkaWarp10Plugin
The Kafka plugin installation is done!
Warp 10 Accelerator
The Warp 10 Accelerator is an option of the standalone version of Warp 10 that adds an in-memory cache to a Warp 10 instance. This cache covers a certain period of time and can be used to store data for ultra-fast access. Learn more about this feature.
Create and edit /opt/warp10_3.0/warp10/etc/conf.d/99-accelerator.conf:
$ sudo -u warp10_docker vim /opt/warp10_3.0/warp10/etc/conf.d/99-accelerator.conf

# Enable accelerator
accelerator = true
# 1 hour chunks
accelerator.chunk.length = 3600000000
# 3 chunks
accelerator.chunk.count = 3
# Set to 'true' to preload the accelerator with the persisted data spanning the accelerator time range.
# Preloading can be disabled for setups where the accelerator is used as a temporary side cache only.
accelerator.preload = true
# Number of threads to use for preloading the Warp 10 Accelerator
accelerator.preload.poolsize = 8
# Size of GTS batches to process when preloading the Warp 10 Accelerator
accelerator.preload.batchsize = 1000
# Set to true to take into account the last activity of Geo Time Series when preloading the Warp 10 Accelerator
accelerator.preload.activity = false
We create 3 chunks of 1 hour each.
The Accelerator configuration is done!
Warp 10 restart
$ docker restart warp10A dummy producer
We will create a small NodeJS script that will produce dummy random data.
In a directory (ie: /home/me/workspace/kafka-producer), run:
$ npm init
This utility will walk you through creating a package.json file.
It only covers the most common items, and tries to guess sensible defaults.

See `npm help init` for definitive documentation on these fields
and exactly what they do.

Use `npm install <pkg>` afterwards to install a package and
save it as a dependency in the package.json file.

Press ^C at any time to quit.
package name: (kafka-producer)
version: (1.0.0)
description:
entry point: (index.js)
test command:
git repository:
keywords:
author:
license: (ISC)
About to write to /home/me/workspace/kafka-producer/package.json:

{
  "name": "kafka-producer",
  "version": "1.0.0",
  "description": "",
  "main": "index.js",
  "scripts": {
    "test": "echo \"Error: no test specified\" && exit 1"
  },
  "author": "",
  "license": "ISC"
}


Is this OK? (yes) yes

$ npm install kafkajs
Then, create /home/me/workspace/kafka-producer/index.js:
const { Kafka, Partitioners } = require('kafkajs');

const kafka = new Kafka({
  clientId: 'my-app',
  brokers: ['localhost:9092'],
});

const producer = kafka.producer({ createPartitioner: Partitioners.LegacyPartitioner });
const consumer = kafka.consumer({ groupId: 'test-group' })

process.on('SIGINT', () => {
  producer.disconnect().then(() => {
    console.log('disconnected');
    process.exit();
  });
});

async function send() {
  await producer.send({
    topic: 'test.topic',
    messages: [
      {
        value: JSON.stringify({
          title: 'Dummy data',
          sensor: {
            name: 'io.warp10.demo.sensor.temperature',
            timestamp: Date.now(), // ok, I know, you should use UTC time
            value: Math.random() * 100.0,
            unit: '°C'
          }
        })
      }
    ]
  });
}

producer.connect().then(async () => {
  console.log('connected');
  await consumer.subscribe({ topic: 'test.topic', fromBeginning: false });
  await consumer.run({
    eachMessage: async ({ topic, partition, message }) => {
      console.log(topic, { message: message.value.toString() }); // for log purpose
    },
  });
  setInterval(async () => await send(), 500); // send a message each 500 ms
});
And run it:
$ node index.jsKafka consumer
In /opt/warp10_3.0/warp10/kafka, create a file named test.mc2 (customize with your IP address):
{
  'topics' [ 'test.topic' ] // The topic list we listen at
  'parallelism' 1
  'config' {
    'group.id' 'warp10'
    'client.id' 'warp10'
    'enable.auto.commit' 'true'
    'bootstrap.servers' '192.168.1.1:9092' // IP of our broker
  }
  'macro' <%
    'message' STORE // Store the raw Kafka payload
    <% $message SIZE 8 == %> // Should be an array containing 8 items
    <%
      // Extract payload and convert it to a map
      $message 'value' GET 'UTF-8' BYTES-> JSON-> 'value' STORE
      'Sensor: ' $value 'sensor' GET 'name' GET  + LOGMSG
      'Value: ' $value 'sensor' GET 'value' GET TOSTRING + $value 'sensor' GET 'unit' GET + LOGMSG
    %> IFT
  %>
  'timeout' 10000
}
At this stage, you will see in /opt/warp10_3.0/warp10/logs/warp10.log:
[1685611811223] Sensor: io.warp10.demo.sensor.temperature
[1685611811223] Value: 25.354849299417314°C
[1685611811323] Sensor: io.warp10.demo.sensor.temperature
[1685611811323] Value: 84.14009403325606°C
[1685611811427] Sensor: io.warp10.demo.sensor.temperature
[1685611811427] Value: 30.510205614640196°C
[1685611811526] Sensor: io.warp10.demo.sensor.temperature
[1685611811526] Value: 55.10942379581509°C
...
Now, modify test.mc2 to convert our data to a GTS and insert it into Warp 10:
{
  'topics' [ 'test.topic'  ]
  'parallelism' 1
  'config' {
    'group.id' 'warp10-1'
    'client.id' 'w'
    'enable.auto.commit' 'true'
    'bootstrap.servers' '192.168.1.1:9092' // IP of our broker
  }
    'macro' <%
    'message' STORE // Store the raw Kafka payload
    <% $message SIZE 8 == %> // Should be an array containing 8 items
    <%
      // Extract payload and convert it to a map
      $message 'value' GET 'UTF-8' BYTES-> JSON-> 'value' STORE
      NEWGTS $value 'sensor' GET 'name' GET RENAME // create a GTS and name it
      {
        'unit' $value 'sensor' GET 'unit' GET     // our unit
        'topic' $message 'topic' GET              // the concerned topic
      } RELABEL 'gts' STORE // add some labels
      // generate a datapoint
      $gts
      // timestamp
      $value 'sensor' GET 'timestamp' GET  1 ms * // convert milliseconds to microseconds
      NaN NaN NaN // latitude longitude and elevation
      $value 'sensor' GET 'value' GET // the value
      ADDVALUE
      "YOUR WRITE TOKEN" UPDATE
    %> IFT
  %>
  'timeout' 10000
}
Open WarpStudio to test our data by fetching the last minute of data:
[
  'YOUR READ TOKEN'
  'io.warp10.demo.sensor.temperature' {}
  NOW 1 m
] FETCH
ACCEL.REPORT
You should have a chart like this:
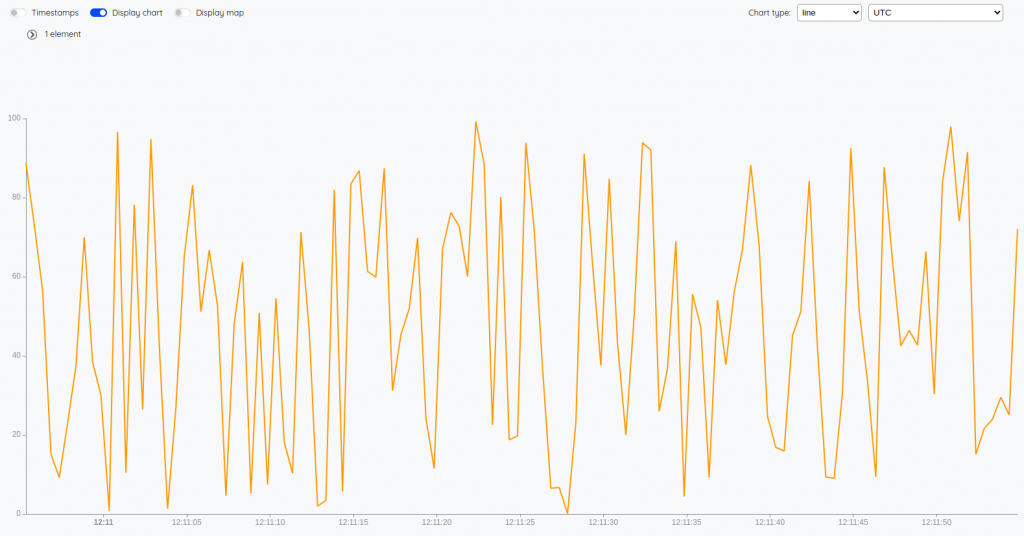
As we are using Warp 10 accelerator, fetching last minute fetch data in RAM, and ACCEL.REPORT should return
"status":true,"accelerated":true
A real-time dashboard displaying live data
Now, it is time to display our live data.
Building a dashboard in WarpStudio
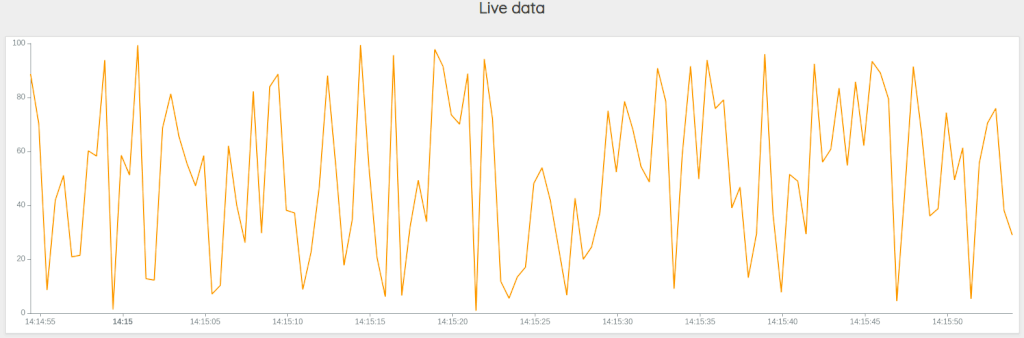
Open WarpStudio and use the "discovery empty dashboard" snippet and modify it to add a line chart ("discovery-tile line, chart" snippet):
// @endpoint http://localhost:8080/api/v0/exec
// @preview discovery
{
'title' 'Live data'
'options' { 'showErrors' true }
'type' 'flex'
'tiles' [
// list of tiles (type discovery-tiles to get some snippets)
{
'type' 'line' 'w' 12 'h' 2
'endpoint' 'ws://localhost:8080/api/v0/mobius' // Use Web sockets
//'endpoint' 'http://localhost:8080/api/v0/exec'
'options' {
'autoRefresh' 500 // each 500 ms
'bounds' { 'yRanges' [ 0 100 ] } // force y axis to be 0-100 range
}
'macro' <%
{
'token' 'YOUR READ TOKEN'
'class' 'io.warp10.demo.sensor.temperature'
'labels' {}
'end' NOW // timestamp or ISO8601 string
'timespan' 1 m // timespan or start
} FETCH
SORT
%>
}
]
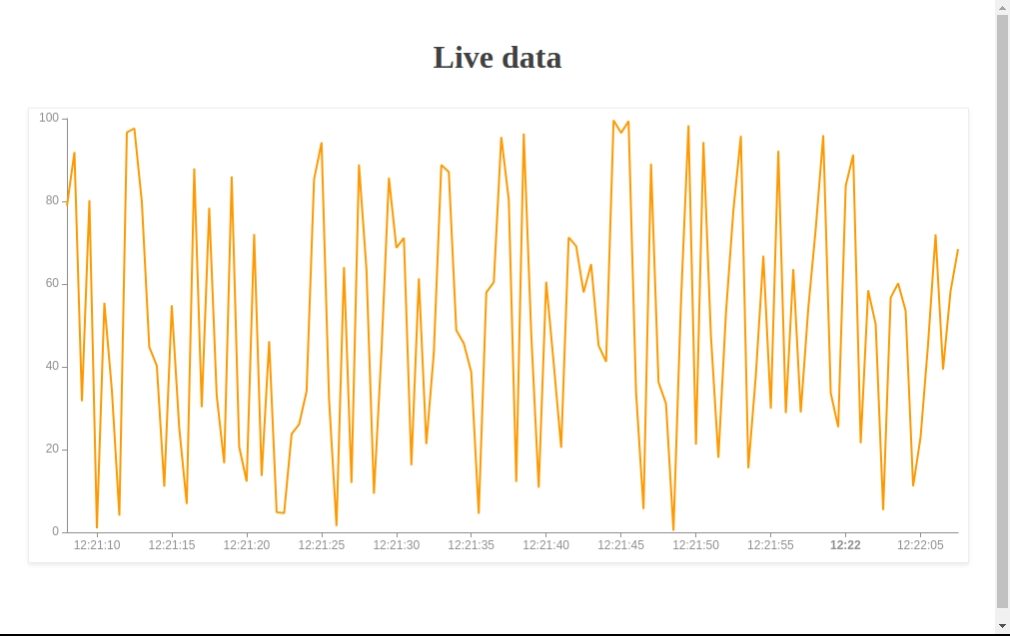
}Execute it and display the "Discovery" tab. You should see something like that:
The Web version of the dashboard
In your workspace, create a file named index.html:
<html lang="en">
<head>
  <title>Live data</title>
</head>
<body>
<discovery-dashboard url="http://localhost:8080/api/v0/exec">
{
  'title' 'Live data'
  'options' { 'showErrors' true  }
  'type' 'flex'
  'tiles' [
    // list of tiles (type discovery-tiles to get some snippets)
    {
      'type' 'line'  'w' 12 'h' 2
      'endpoint' 'ws://localhost:8080/api/v0/mobius' // Use Web sockets
      //'endpoint' 'http://localhost:8080/api/v0/exec'
      'options' {
        'autoRefresh' 500 // each 500 ms
        'bounds' { 'yRanges' [ 0 100 ] }  // force y axis to be 0-100 range
      }
      'macro' <%
        {
          'token'  'YOUR READ TOKEN'
          'class'  'io.warp10.demo.sensor.temperature'
          'labels' {}
          'end' NOW // timestamp or ISO8601 string
          'timespan' 1 m  // timespan or start
        } FETCH
        SORT
      %>
    }
  ]
}
</discovery-dashboard>
<script nomodule src="https://unpkg.com/@senx/discovery-widgets/dist/discovery/discovery.js"></script>
<script type="module" src="https://unpkg.com/@senx/discovery-widgets/dist/discovery/discovery.esm.js"></script>
</body>
</html>
Open it in your favorite browser to see your live data.
Going further
You can customize your Kafka handler by increasing the parallelism.
You can also pimp your dashboard:
<html lang="en">
<head>
  <title>Live data</title>
  <style>
    @import url('https://fonts.googleapis.com/css?family=Jura:300,400,500,600,700&subset=cyrillic,cyrillic-ext,latin-ext');

body {
    font-family: 'Jura', sans-serif;
    font-size       : 12px;
    line-height     : 1.52;
    background : fixed url(https://robertsspaceindustries.com/rsi/static/images/gridbg_glow.png), url(https://robertsspaceindustries.com/rsi/static/images/common/bg-stars-2560.jpg) repeat;
    color           : #FFFFFF;

    --wc-split-gutter-color            : #404040;
    --warp-view-pagination-bg-color    : #343a40 !important;
    --warp-view-pagination-border-color: #6c757d;
    --warp-view-datagrid-odd-bg-color  : rgba(255, 255, 255, .05);
    --warp-view-datagrid-odd-color     : #FFFFFF;
    --warp-view-datagrid-even-bg-color : #212529;
    --warp-view-datagrid-even-color    : #FFFFFF;
    --warp-view-font-color             : #FFFFFF;
    --warp-view-chart-label-color      : #FFFFFF;
    --gts-stack-font-color             : #FFFFFF;
    --warp-view-resize-handle-color    : #111111;
    --warp-view-chart-legend-bg        : #000;
    --gts-labelvalue-font-color        : #ccc;
    --gts-separator-font-color         : #FFFFFF;
    --gts-labelname-font-color         : rgb(105, 223, 184);
    --gts-classname-font-color         : rgb(126, 189, 245);
    --warp-view-chart-legend-color     : #FFFFFF;
    --wc-tab-header-color              : #FFFFFF;
    --wc-tab-header-selected-color     : #404040;
    --warp-view-tile-background        : #3A3C46;
}

.discovery-dashboard {
    color: transparent;
}
  </style>
</head>
<body>
<discovery-dashboard url="http://localhost:8080/api/v0/exec">
  {
    'title' 'Live data'
    'type' 'flex'
    'options' {
      'scheme' 'BELIZE'
    }
    'tiles' [
      {
        'type' 'area'  'w' 12 'h' 2
        'endpoint' 'ws://localhost:8080/api/v0/mobius' // Use Web sockets
        'options' {
          'autoRefresh' 500 // each 500 ms
          'bounds' { 'yRanges' [ 0 100 ] }
        }
        'macro' <%
          [ 'oQ4t3FJSguXk2jOsXx2b3NNY7MdkrroX0VYfQmm0QyCMGsYgLDNHIEqELzS2htyLbKel1tryEuDmor62GcHzhZ5pO2PC3opZ1RwIUEYTDIsYyVN8N8pcyfgkDkbnNG0qtJZwfnmsUCXo3vvRGg0Q5.' 'io.warp10.demo.sensor.temperature' {} NOW 1 m ] FETCH
        %>
      }
    ]
  }
</discovery-dashboard>
<script nomodule src="https://unpkg.com/@senx/discovery-widgets/dist/discovery/discovery.js"></script>
<script type="module" src="https://unpkg.com/@senx/discovery-widgets/dist/discovery/discovery.esm.js"></script>
</body>
</html>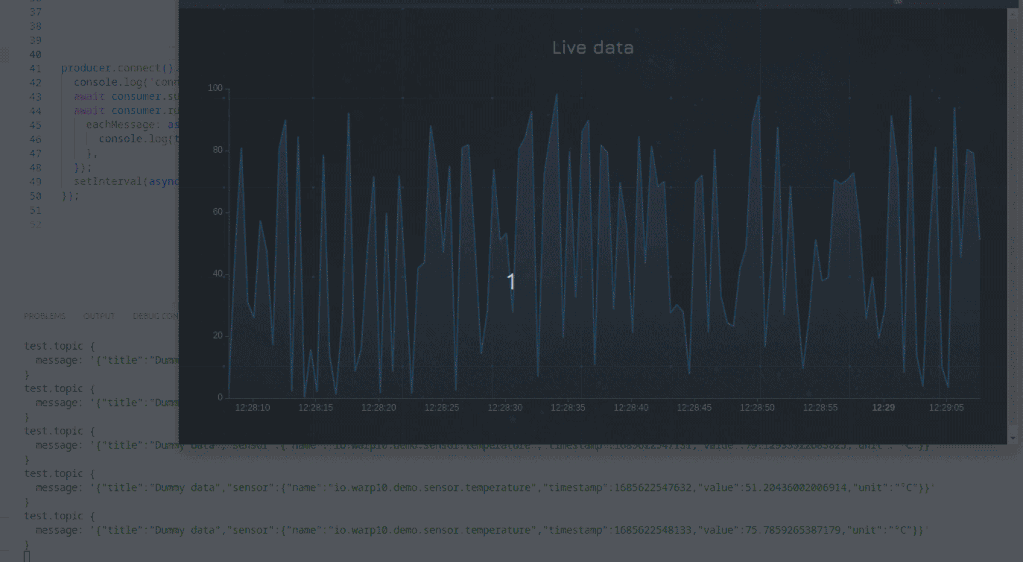
Here is a complete sample.
Read more
W. Files Conspiracy vol. 2: Spy drones over UDP
Working with GEOSHAPEs: code contest!
Create a custom tile for Discovery

Senior Software Engineer