Discover the Point of Interest feature in Discovery. How to handle it and store new datapoints selected by an end user.
We recently added a new feature in Discovery. It is called "Point of Interest" (POI for short). The main goal of this feature is to provide a way to mark a datapoint in a chart and do something with it, like storing a value in a new GTS.
POIs are supported by various charts: line, spline, stepped, area, spline-area, map, scatter, bar, and annotations.
In this blog post, I will teach you how to use it.
Define a dashboard
To do so, go to https://studio.senx.io/ and use our "discovery" snippet. Here is the scaffold of our dashboard.
// @endpoint https://sandbox.senx.io/api/v0/exec
// @preview discovery
{
  'title' 'Discovery Dashboard'
  'endpoint' 'https://sandbox.senx.io/api/v0/exec'
  'vars' {
   'myPOIs' [] // the var will handle our POIs
    'now' NOW // For convenience, we keep a start time
  }
  'tiles' [
// add tiles here
  ]
}
Dataset sample
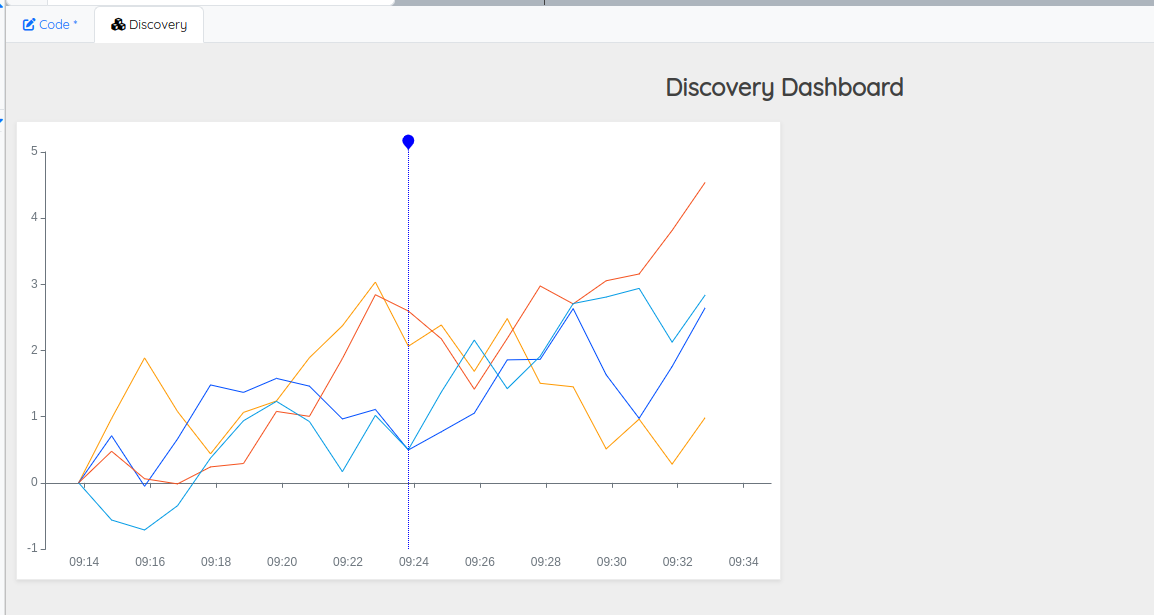
Now, we can add our first tile that represents our dataset:
{
  'type' 'line'  'x' 0 'y' 0 'w' 6 'h' 2
  'options' { 'poi' true 'poiColor' 'blue' 'poiLine' 'dotted' } // enable and customize POIs
  'macro' <%
    [ 1 4 <% 'i' STORE 20 @senx/rand/RANDOMWALK 'gts-' $i TOSTRING + RENAME %> FOR ]
    1 m TIMESCALE $now 20 m - TIMESHIFT 'data' STORE // our dataset
    { // Define a custom data structure for the tile
      'data' $data // our data
      'globalParams' { 'bounds' { 'minDate' $now 21 m - 'maxDate' $now 1 m + }  } // temporal bounds
      'events' [ { 'tags' [ 'pois' ] 'type' 'poi' 'selector' 'myPOIs' } ] // Create an event emitter for POIs
    }
  %>
}
You should obtain something like this when you click on a datapoint:
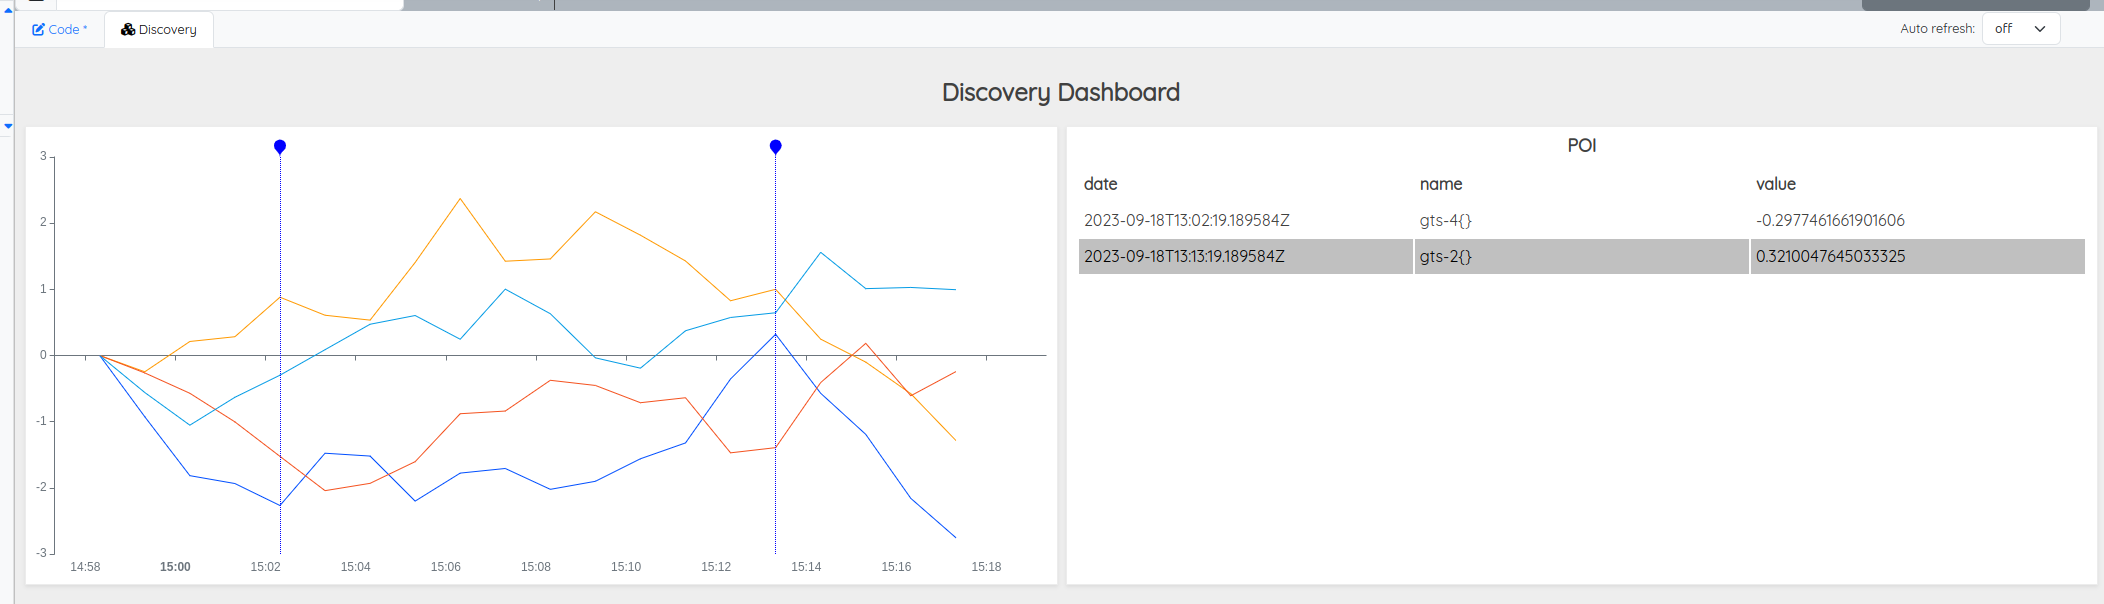
Display POIs in an array
The next step is to simply display our POIs.
Just add a new "tabular" tile that handles POIs events:
{ // Display selected POIs
  'title' 'POI'
  'type' 'tabular' 'x' 6 'y' 0 'w' 6 'h' 2
  'options' {
    'tabular' { 'fixedWidth' T }
    'eventHandler' 'type=poi,tag=pois' // Handle POI events
  }
  'macro' <%
    {
      'data' {
        'columns'  [ 'date' 'name' 'value' ]
        'rows' $myPOIs <% 'date' GET %> SORTBY <% // For each POI
          'p' STORE
          [
            $p 'date' GET TOLONG ISO8601
            $p 'name' GET
            $p 'value' GET
          ]
        %> F LMAP
      }
    }
  %>
}
Here is the result:
Store Points of Interest into a GTS
At first, we generate (for this post) tokens for the Sandbox. Go to https://sandbox.senx.io/ and click on "Enter Sandbox". Keep somewhere read, write, and tokens.
Update the dashboard variables:
{
  'title' 'Discovery Dashboard'
  'vars' {
    'rt' '<the read token>'
    'wt' '<the write token>'
    'dt' '<the delete token>'
    'myPOIs' []
  }
  'endpoint' 'https://sandbox.senx.io/api/v0/exec'
  'options' {  }
  'tiles' [
...
Now, we add a hidden tile in order to handle POIs and store them in a specific GTS.
In this sample, we will store booleans at the given timestamp. But, you can also remove a Point of Interest by clicking on a datapoint with a matching timestamp. So, the easiest way to handle this case is to delete all POIs from our GTS before inserting new ones.
Add the hidden tile:
{
'type' 'hidden'
'x' 0 'y' 0 'w' 0 'h' 0
'options' {
'eventHandler' 'type=poi,tag=pois' // Handle POI events
}
'macro' <%
$dt 'io.senx.sample.poi{}' MINLONG MAXLONG MAXLONG DELETE DROP // delete all
NEWGTS 'io.senx.sample.poi' RENAME // create a GTS
$myPOIs <% // For each POI
'p' STORE
$p 'date' GET NaN NaN NaN true ADDVALUE // Add point
%> FOREACH $wt UPDATE // Insert the GTS
%>
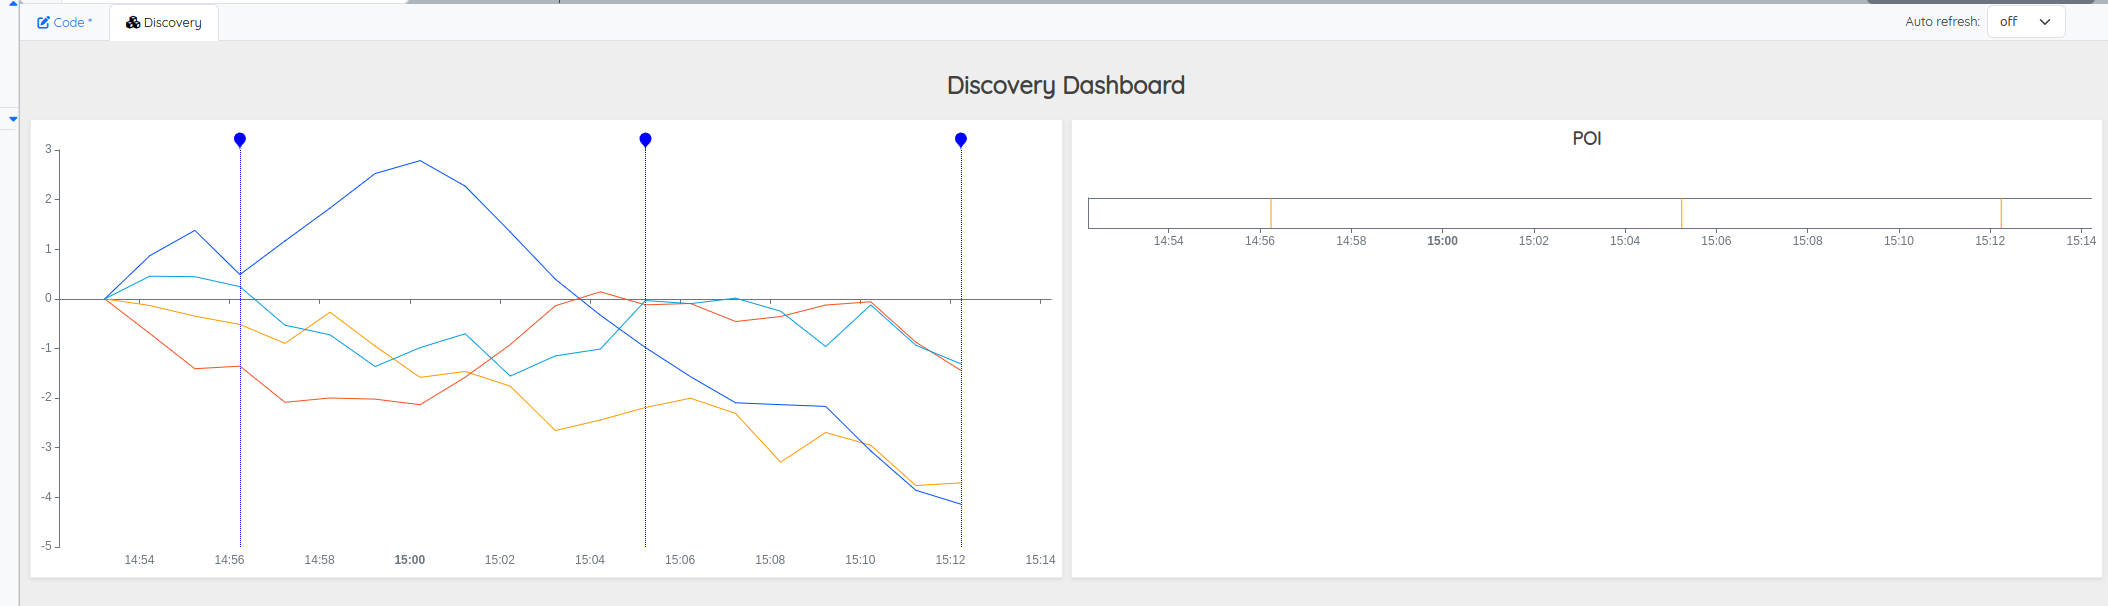
}Display the POI GTS
Now we can remove the tabular tile and add an annotation tile with an auto-refresh over websocket feature:
{ // Display selected POIs
  'title' 'POI'
  'type' 'annotation' 'x' 6 'y' 0 'w' 6 'h' 2
  'endpoint' 'wss://sandbox.senx.io/api/v0/mobius' // Web socket support
  'options' { 'autoRefresh' 500 }  // refresh each 500 ms
  'macro' <% {
    [ $rt 'io.senx.sample.poi' {} $now -1000 ] FETCH 'data' STORE  // get data
    {
      'data' $data
      'globalParams' { 'bounds' { 'minDate' $now 21 m - 'maxDate' $now 1 m + } }  // temporal bounds
    }
  %>
}
Here is the final result:
You can find the complete code here. Obviously, you have to use your own tokens and replace placeholders.
Going further
Now you know how to use Points of Interest in Discovery. But you can also define a more complex behavior:
- by preloading the POI GTS within the line chart and using the marker mechanism to symbolize them.
- by adding a test at the first display of the annotation chart to avoid a complete deletion of POIs
You can learn much more about Discovery by reading specific blog posts or by visiting the dedicated web site.
Have fun.
Read more
2022 review of the Warp 10 platform
Discovery Explorer - The dashboards server
Remote dashboards with Discovery Explorer

Senior Software Engineer