Learn how to create micro-benchmarks in WarpScript with the JMH extension.
In a previous post, we explained how to measure execution time in WarpScript to help you optimize your code and monitor your macros use. In this post, we're going one step further by using the JMH extension to create micro-benchmarks. They can give us a much more precise idea of how to optimize our code.
Why would you want to use JMH for your benchmarks?
First, because WarpScript code can run on a large amount of data, and you must keep in mind to optimize your code to avoid long execution times. By comparing solutions with benchmarks, you can choose the fastest solution.
Second, because benchmarks are hard to achieve properly. Java does a lot of optimizations, and you may be measuring the execution time of bytecode unrelated to your problem.
Disclaimer
Since we're going in the dark realms of benchmarks, a word of warning first.

REMEMBER: The numbers below are just data. To gain reusable insights, you need to follow up on why the numbers are the way they are. Use profilers […], design factorial experiments, perform baseline and negative tests that provide experimental control, make sure the benchmarking environment is safe on JVM/OS/HW level, ask for reviews from the domain experts. Do not assume the numbers tell you what you want them to tell.
JMH code
Now that we've been warned, we can arm ourselves with the extension and start some benchmarks.
Setting the Extension up
The JMH extension is available on WarpFleet. If you're not familiar with the wf command, I suggest you read this article first. Then, installing the extension is simply a matter of running the following command:
wf g -w /path/to/warp10 io.warp10 warp10-ext-jmhSelect the latest version and accept the modification to your configuration. After that, restart your Warp 10 instance, and you're done.
| Read more about WarpFleet: how to publish Warp 10 extensions |
Running your First JMH Benchmarks
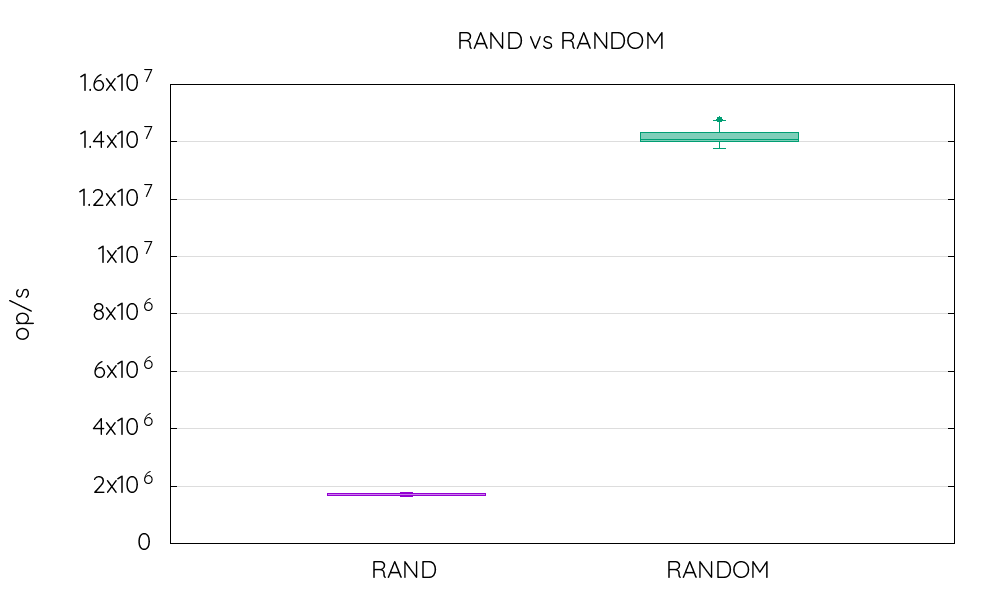
Now that you have access to the JMH function, we will start with an easy benchmark: which of the RAND or RANDOM function is faster? A small hint, RAND is cryptographically secure while RANDOM is not.
To do that, we simply enclose the functions in macros, leave an empty map of options to use the default values and call the JMH function.
<% RAND %> {} JMH
<% RANDOM %> {} JMH
Yes, that does take a lot of time to complete, around 17 minutes on my laptop. The output is quite detailed too but the most important part is, for RANDOM:
"score": 1.4172416858970411E7,
"scoreError": 204524.61630589954,
"scoreUnit": "ops/s",
And for RAND:
"score": 1700714.7961901093,
"scoreError": 33148.92327156623,
"scoreUnit": "ops/s",
So that means RANDOM is approximately 8 times faster that RAND, which means in turn that if you rely a lot on random numbers which aren't used for cryptography, you definitively have to chose RANDOM.
In short, that's how you perform a very basic benchmark. It is possible to run for less time? To reuse objects of the stack? To benchmark fetch times? Yes, yes, and yes. Here is how.
Tuning your JMH Benchmarks
There are many ways of customizing your benchmarks. We will cover the main options for you to be able to create benchmarks for your own code.
Memory Use
By default, JMH forks several JVMs to run the benchmarks on. They inherit the parameters of the JVM you run your WarpScript on. This can use a lot of memory if your instance is configured to use several GB.
In the configuration map you provide, you can override this by setting the mem key to a value of somenumber[g|G|m|M|k|K] or without the unit for bytes. If your benchmark does not require that much memory, you can set it to 64m even if the bare minimum seems to be around 6m.
Duration of the Benchmark
Our first benchmark lasted around 17 minutes, why that? If you looked through the report, you should have seen that JMH created 5 forks with 5 warm-up iterations of 10 seconds and 5 measurement iterations of 10 seconds. 5*(5*10+5*10)=500 seconds, we made 2 calls to JMH so that's 1000 seconds or 16 minutes and 20 seconds if you prefer.
If you want to reduce the confidence interval, you should increase all these parameters, but if you just want to test your benchmark setup, reducing them will make this process much easier. You can use that configuration for instance, it should take around 3 seconds to run the benchmark:
{
  'forks' 1
  'warmupIterations' 1
  'measurementIterations' 1
  'warmupTime' '1 s'
  'measurementTime' '1 s'
}
Forks
As stated earlier, all the forks created inherit the parameters of the JVM you run your script on. That also means you can use all the extensions and plugins you have on your instance on these forks. However, you cannot access the directory and store, which means FIND and FETCH will fail.
Well, there is a way to test FIND and FETCH speeds in JMH, but it uses a non-recommended setting. If you set forks to 0 in the configuration map, your benchmark will run on the same JVM as your macro. This has an impact on the precision of your results, that's why it's not recommended. If you also set egress.clients.expose = true in your conf.d/10-egress.conf configuration file, you can then use FIND and FETCH in your JMH benchmark.
If your purpose is to run your benchmark on some data you have, you're better to use WRAP on your data and use the following method.
Setup and Tear Down
For now, we only considered simple functions that do not expect an input. If we wanted to benchmark COS, for instance, we could use <% RANDOM COS %> but that would mean we're also benchmarking the RANDOM function, which is not the goal.
This is why you can give a map of several macros to define what happens before and after the execution of your macro. This map must have the macro key, which is the macro you want to benchmark, and several optional keys:
pretrial, at the start of each fork,preiteration, at the start of each iteration,preinvocation, before each call of your macro,postinvocation, after each call of your macro, if not set, defaults to<% CLEAR %>,postiteration, at the end of each iteration,posttrial, at the end of each fork.
You can read this if you want more information on what are trials, iterations, and invocations.
Back to our COS example, the best way to benchmark only this function would be:
{
  'preinvocation'  <% RAND %>
  'macro'          <% COS %>
  'postinvocation' <% DROP %>
}
{}
JMH
Others
On top of the options listed above, the configuration map also accepts the following keys you might find useful: mode (thrpt, avgt, sample, ss or all), timeUnit and profilers.
Profilers can give much more information on how your code perform. On most Linux machines, the following profilers should be available: cl, comp, gc, hs_cl, hs_comp, hs_gc, hs_rt, hs_thr, pauses, safepoints and stack.
| To read: How to Backup and Restore your data with Warp 10 |
Putting it Together
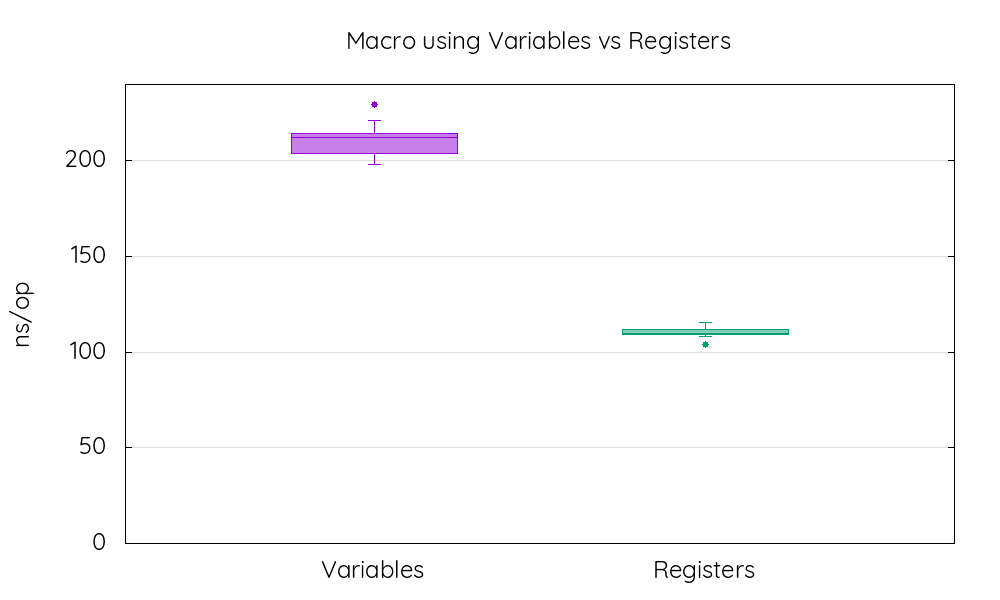
Now that we covered most options, we can do a real JMH benchmarks that can help you in your future developments. Since the 2.0.0 version, we added the ASREGS function, which can convert variables to registers. I personally use it a lot to boost the performance of my code without reducing readability.
To test the performance gain provided by ASREGS, we define a benchmark consisting of executing a simple macro storing the value and then loading it. The first version is using variables, while the second is using registers thanks to ASREGS.
This macro needs only to be created only once per fork, so we can put it in pretrial. Then some parameters must be given to this macro, we do that in before invocation. We don't want the retrieval of the macro in the variables to affect our benchmark, so we load it before invocation too. The macro will simply evaluate the macro with EVAL. After the invocation, the stack will be cleared with CLEAR by default, so no there's need to set a postinvocation macro. This benchmark looks like this:
{
  'forks' 5
  'mem' '64m'
  'warmupIterations' 3
  'measurementIterations' 5
  'warmupTime' '1 s'
  'measurementTime' '5 s'
  'timeUnit' 'NANOSECONDS'
  'mode' 'avgt'
  }
'jmh_options' STORE

{
  'pretrial' <% <% 'var' STORE $var %> 'macrowithvars' STORE %>
  'preinvocation' <% RANDOM $macrowithvars %>
  'macro' <% EVAL %>
}
$jmh_options
JMH

{
  'pretrial' <% <% 'var' STORE $var %> ASREGS 'macrowithregs' STORE %>
  'preinvocation' <% RANDOM $macrowithregs %>
  'macro' <% EVAL %>
}
$jmh_options
JMH
You can find the detailed output here but the most interesting part is, for the version using variables:
"score": 210.88541217169015,
"scoreError": 5.722354062639168,
"scoreUnit": "ns/op",
And for the version using registers:
"score": 110.77029093360863,
"scoreError": 1.9802278971235183,
"scoreUnit": "ns/op",
This time I used the average time mode, so lower is better. The version using registers produced by ASREGS is almost twice faster than the version using variables. This can have a big impact on the performance of your code if you use macros with variables that are run many times (think macromappers for instance).
Takeaways
If you need to create micro-benchmarks in WarpScript you definitively have to use the JMH extension. It enables you to use the well known Java Microbenchmark Harness with a simple function call.
With this extension, we showed in this post that RANDOM is a lot faster than RAND and ASREGS can make macros making heavy use of variables a lot faster too.
Again, as a final warning, don't try to optimize at the cost of readability unless totally necessary and be careful of the confirmation bias when you interpret benchmark results.
Finally, if you are hungry for performance, I suggest you read the posts on SHM and accelerator for blazing-fast access to your data.
Read more
September 2020: Warp 10 release 2.7.0, ready for FLoWS
WarpScript in Jupyter notebooks
Warp 10 Raspberry Pi 4 benchmark for industrial IoT

WarpScript™ Doctor