The ResEl association uses Warp 10 for its day-to-day activities, from user QoS management to server monitoring & energy optimization.

The ResEl is a French associative ISP managed on a volunteer basis by students, located near Brest and Rennes. They have been around for about 30 years and provide low-cost, quality Internet access and various services to the students of their school.
But students can sometimes be very demanding and the quality of service is of utmost importance. Three years ago, they decided to revamp their infrastructure. And Warp 10, about which one of the students had heard, was chosen for their data processing.
Infrastructure monitoring
At the Resel, we have dozens of servers and virtual machines that need to be properly monitored.
Here, that’s the job of Icinga, one of the many forks of Nagios. In the past, our server metrics were produced by Munin, a great monitoring tool. And Icinga regularly checked, with its check_munin plugin, if everything was working as expected. But we wanted to give Warp 10 a shot.
We first developed a metric collector, to send our server metrics to our Warp 10 instance, then we made a check_warp10 plugin for Icinga.

To avoid reinventing the wheel, we are currently developing a compatibility layer with Munin so that we can use its monitoring scripts directly.
Along with alerting, visualization is important. We have been using Grafana for a long time, so we continued using it and operated our migration from InfluxDB to Warp 10, a choice that we do not regret three years later.

Our current Warp 10 setup is a standalone node with two quad-core 3.60 GHz CPUs and 144 GB of RAM. Probably overkill, as we ingest a very modest 120 datapoints per second. But hey, it’s fast!
Sure, we were able to replace Munin and InfluxDB pretty easily, but at the time, we were only using Warp 10 for fun. Soon enough came the time when we used it for fun AND profit.
User services
Troubleshooting
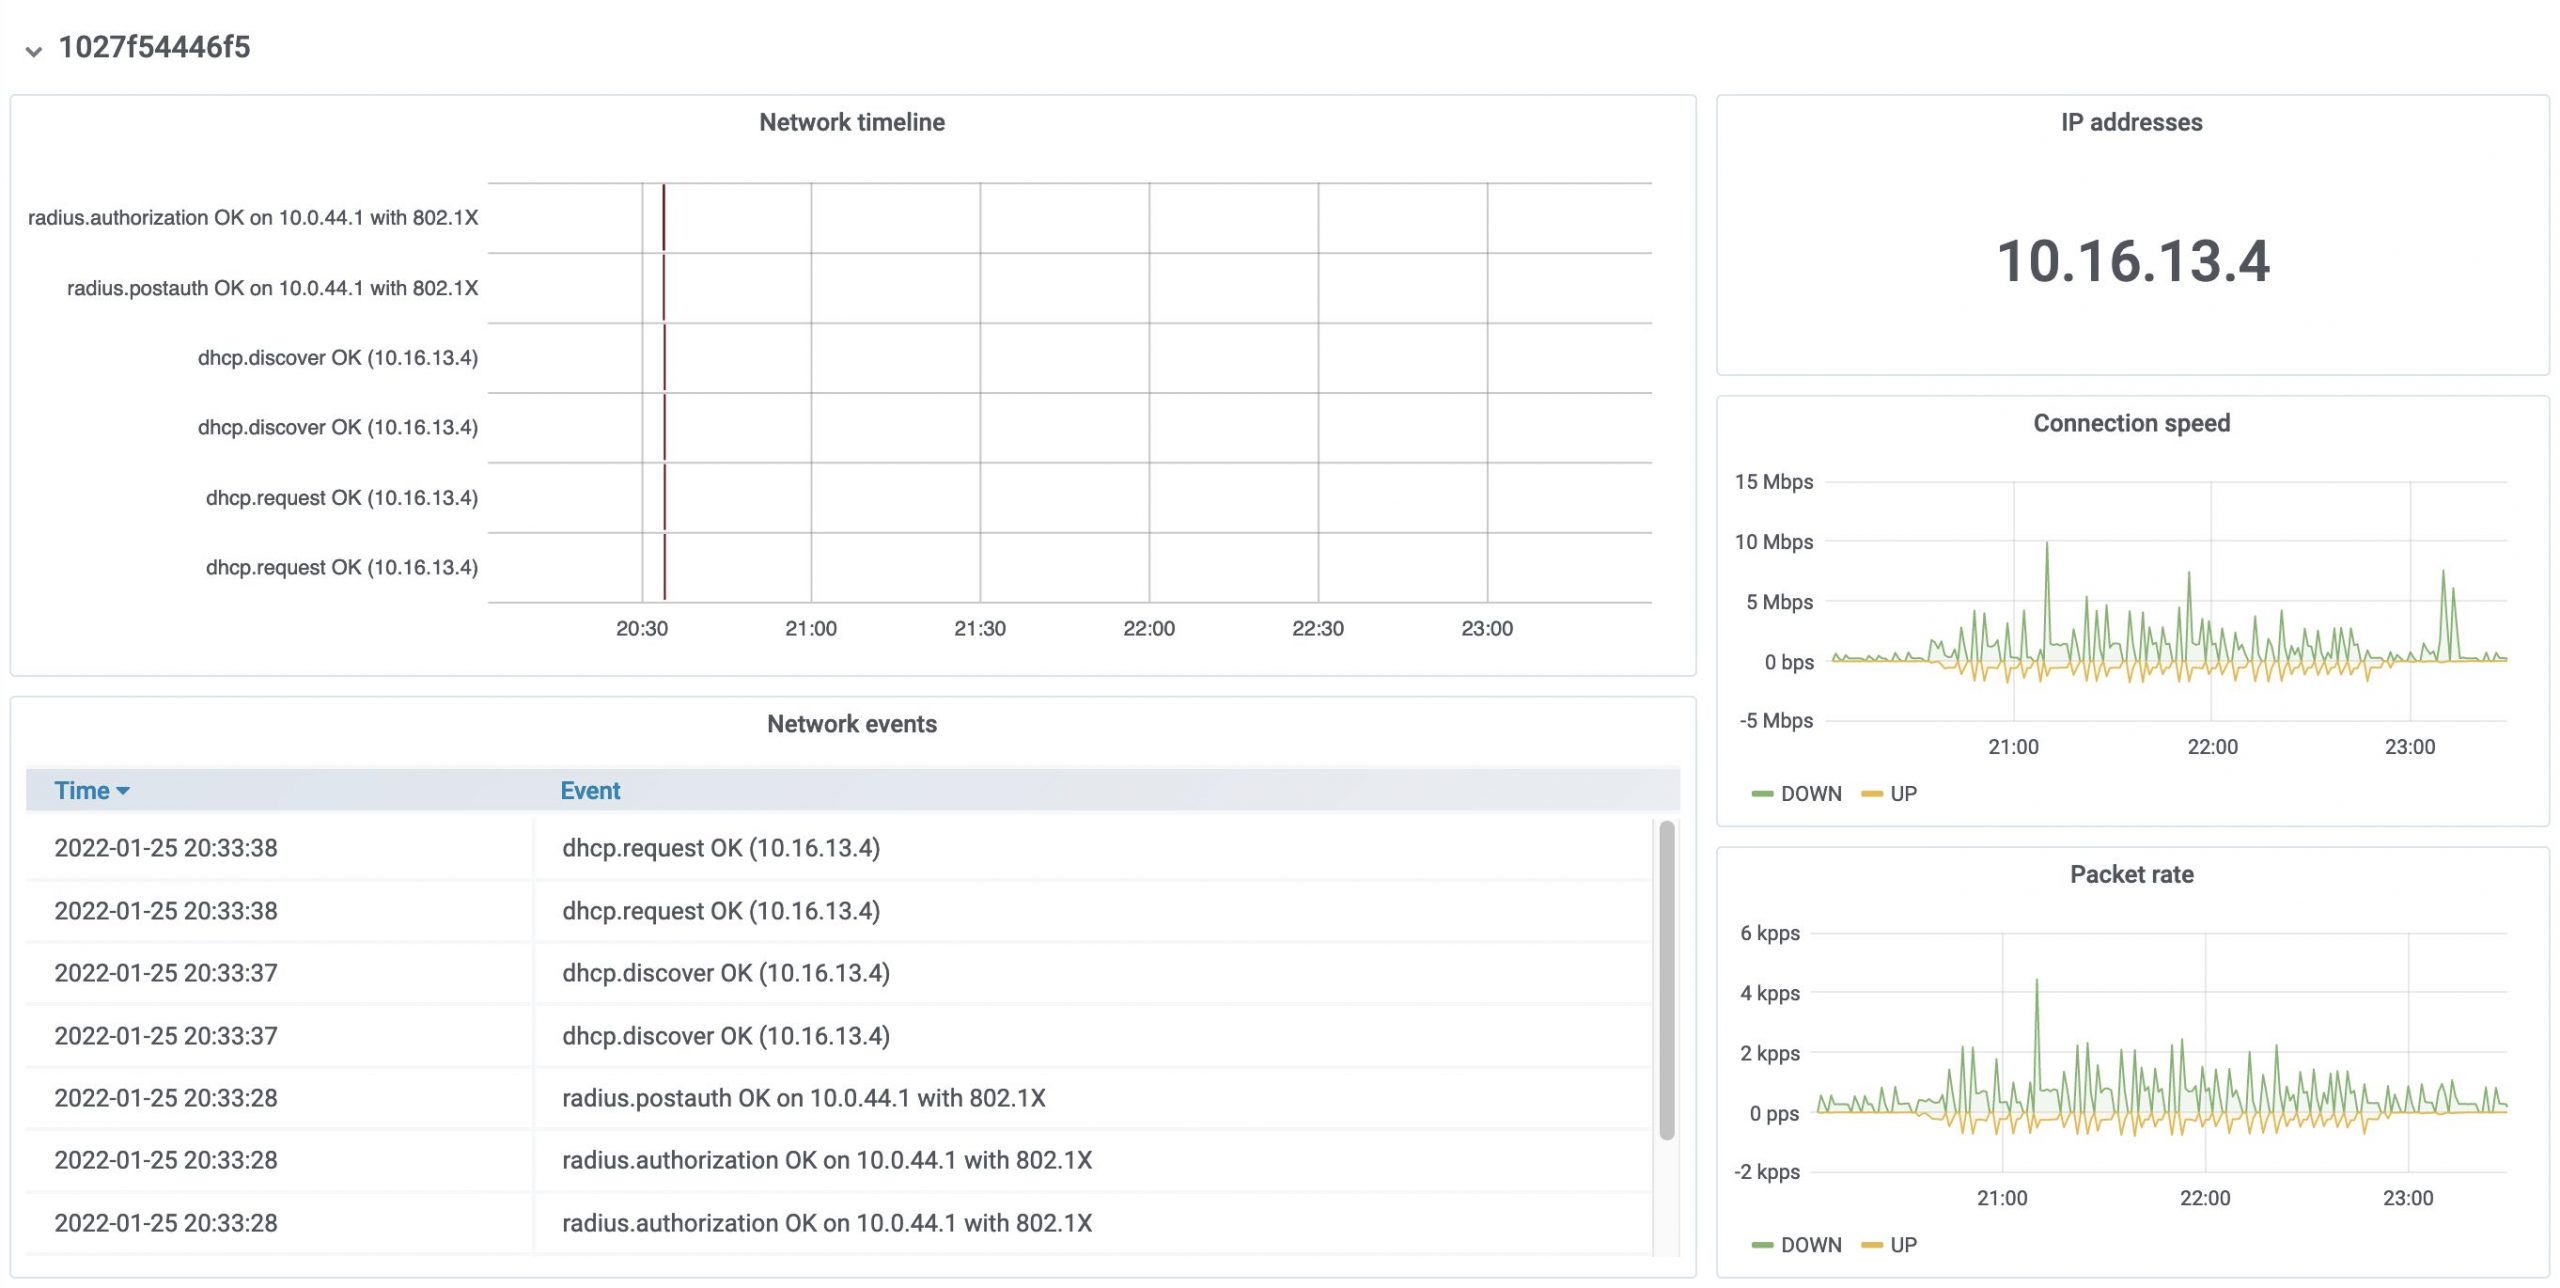
We don’t just use Warp 10 for your typical numeric time series. As a matter of fact, Warp 10 has become a kind of event monitor in our ISP infrastructure: each time a user authenticates on our RADIUS servers or gets an IP from our DHCP, the event, with its necessary metadata, is recorded.
The benefit is threefold:
- In case of a legal procedure, we can fetch the necessary data in just a few clicks. We can also delete the data after some time to comply with the law.
- We can better troubleshoot user problems: whether someone tries to connect with the wrong password or has a misconfiguration, we have a dashboard summarizing these events. We plan to use Warp 10 for automatic incident detection to send our users detailed instructions on how to solve their problems. Less troubleshooting for us, less waiting for the user: it’s gonna be a win-win!
- Good Wi-Fi coverage is hard to get. Believe me, really hard. And your network could be as good as you want, if your coverage isn’t optimal, that’s what your users will remember. Warp 10 knows where our access points are located. Thanks to its native ability to deal with geographical data, we can identify overloaded access points, buildings that need more hotspots, and even isolate faulty ones if we receive several complaints. All this with a single WarpScript file (and a hefty homemade macro library)!
Data usage
Our users can review their data usage device by device on our website. It can give them an insight into their Internet habits, or fuel a contest of who downloads the most (I’m not sure I want to know).
Currently, the information is fetched server side. But we will in our next big backend update give to each user a read token so that they can query Warp 10 for their data. Furthermore, it will help to deal with Data Subject Access Requests (DSAR), because our users will be able to fetch themselves their own data.
Energy optimization
Most of our services run on a big HP C7000 chassis and the electricity bill can be… substantial!
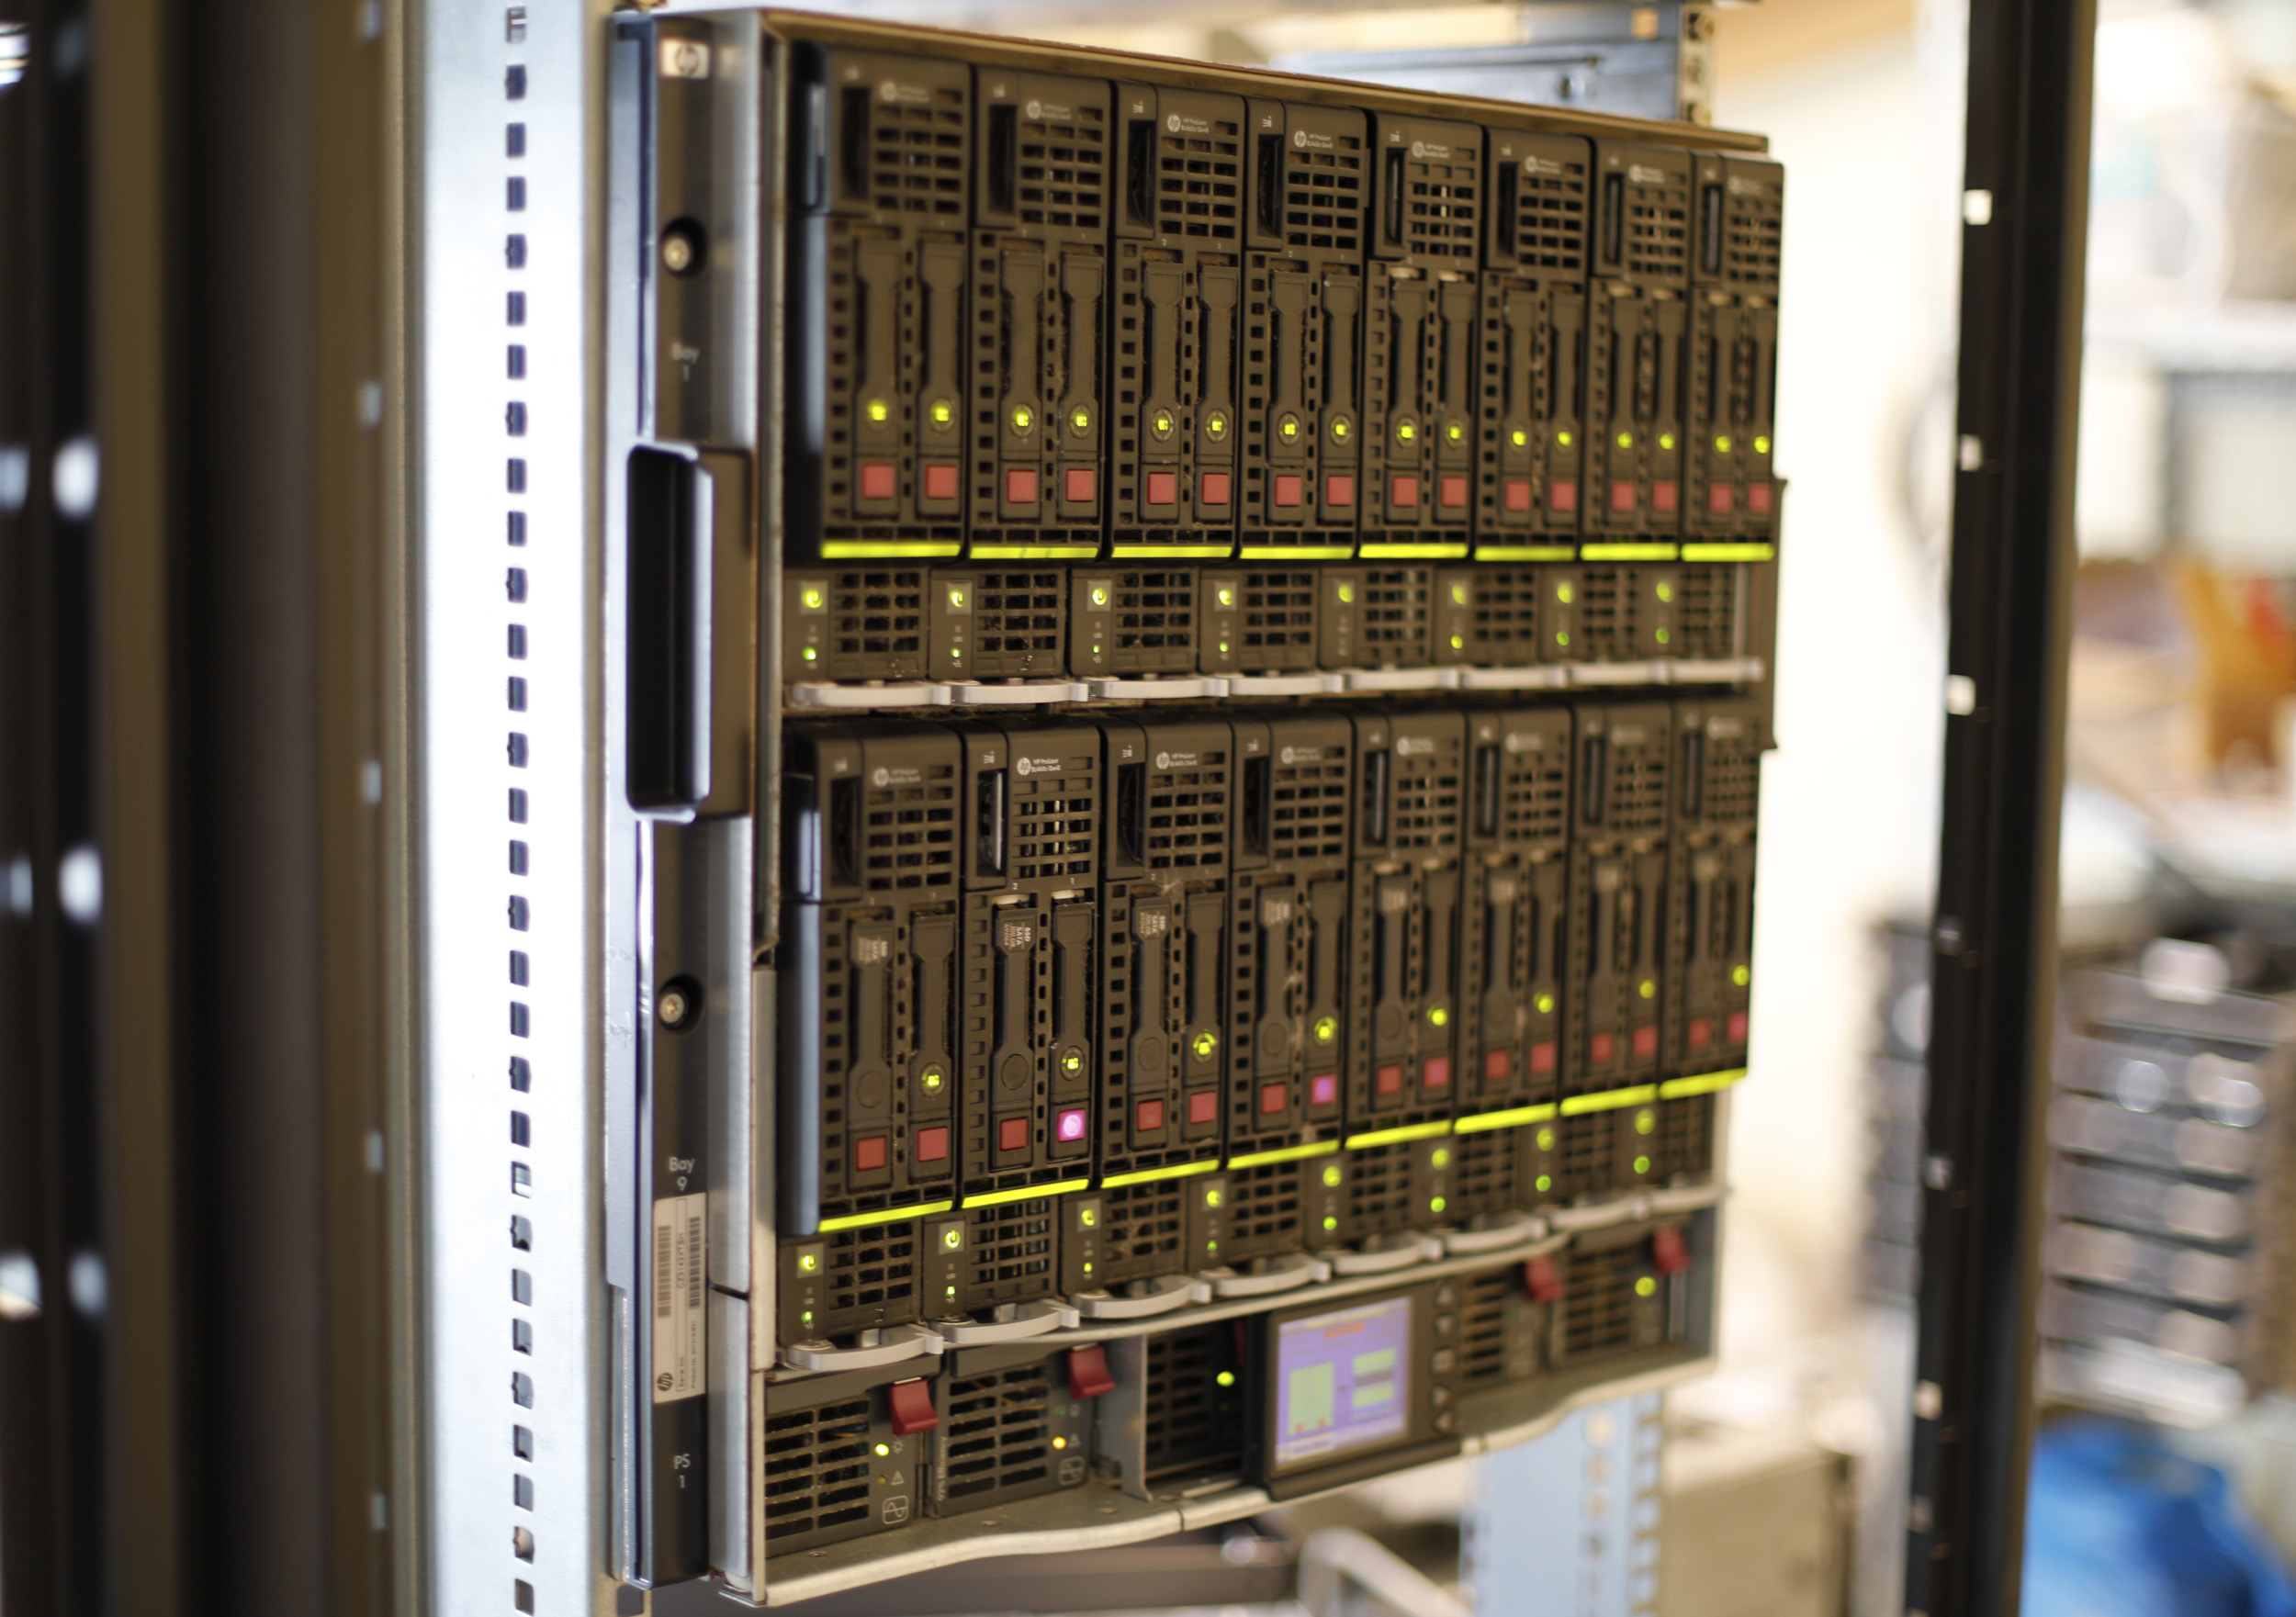
Although we love to use Warp 10 in real-time, it can sometimes be pretty useful for one-shot studies. Here is one. Our most recent project was to work on the energy consumption of our hyper vision cluster, running on half the servers of our chassis. This cluster is somewhat oversized: the virtual machines could fit on four of the eight servers. But does it matter that much? Well, here comes Warp 10.
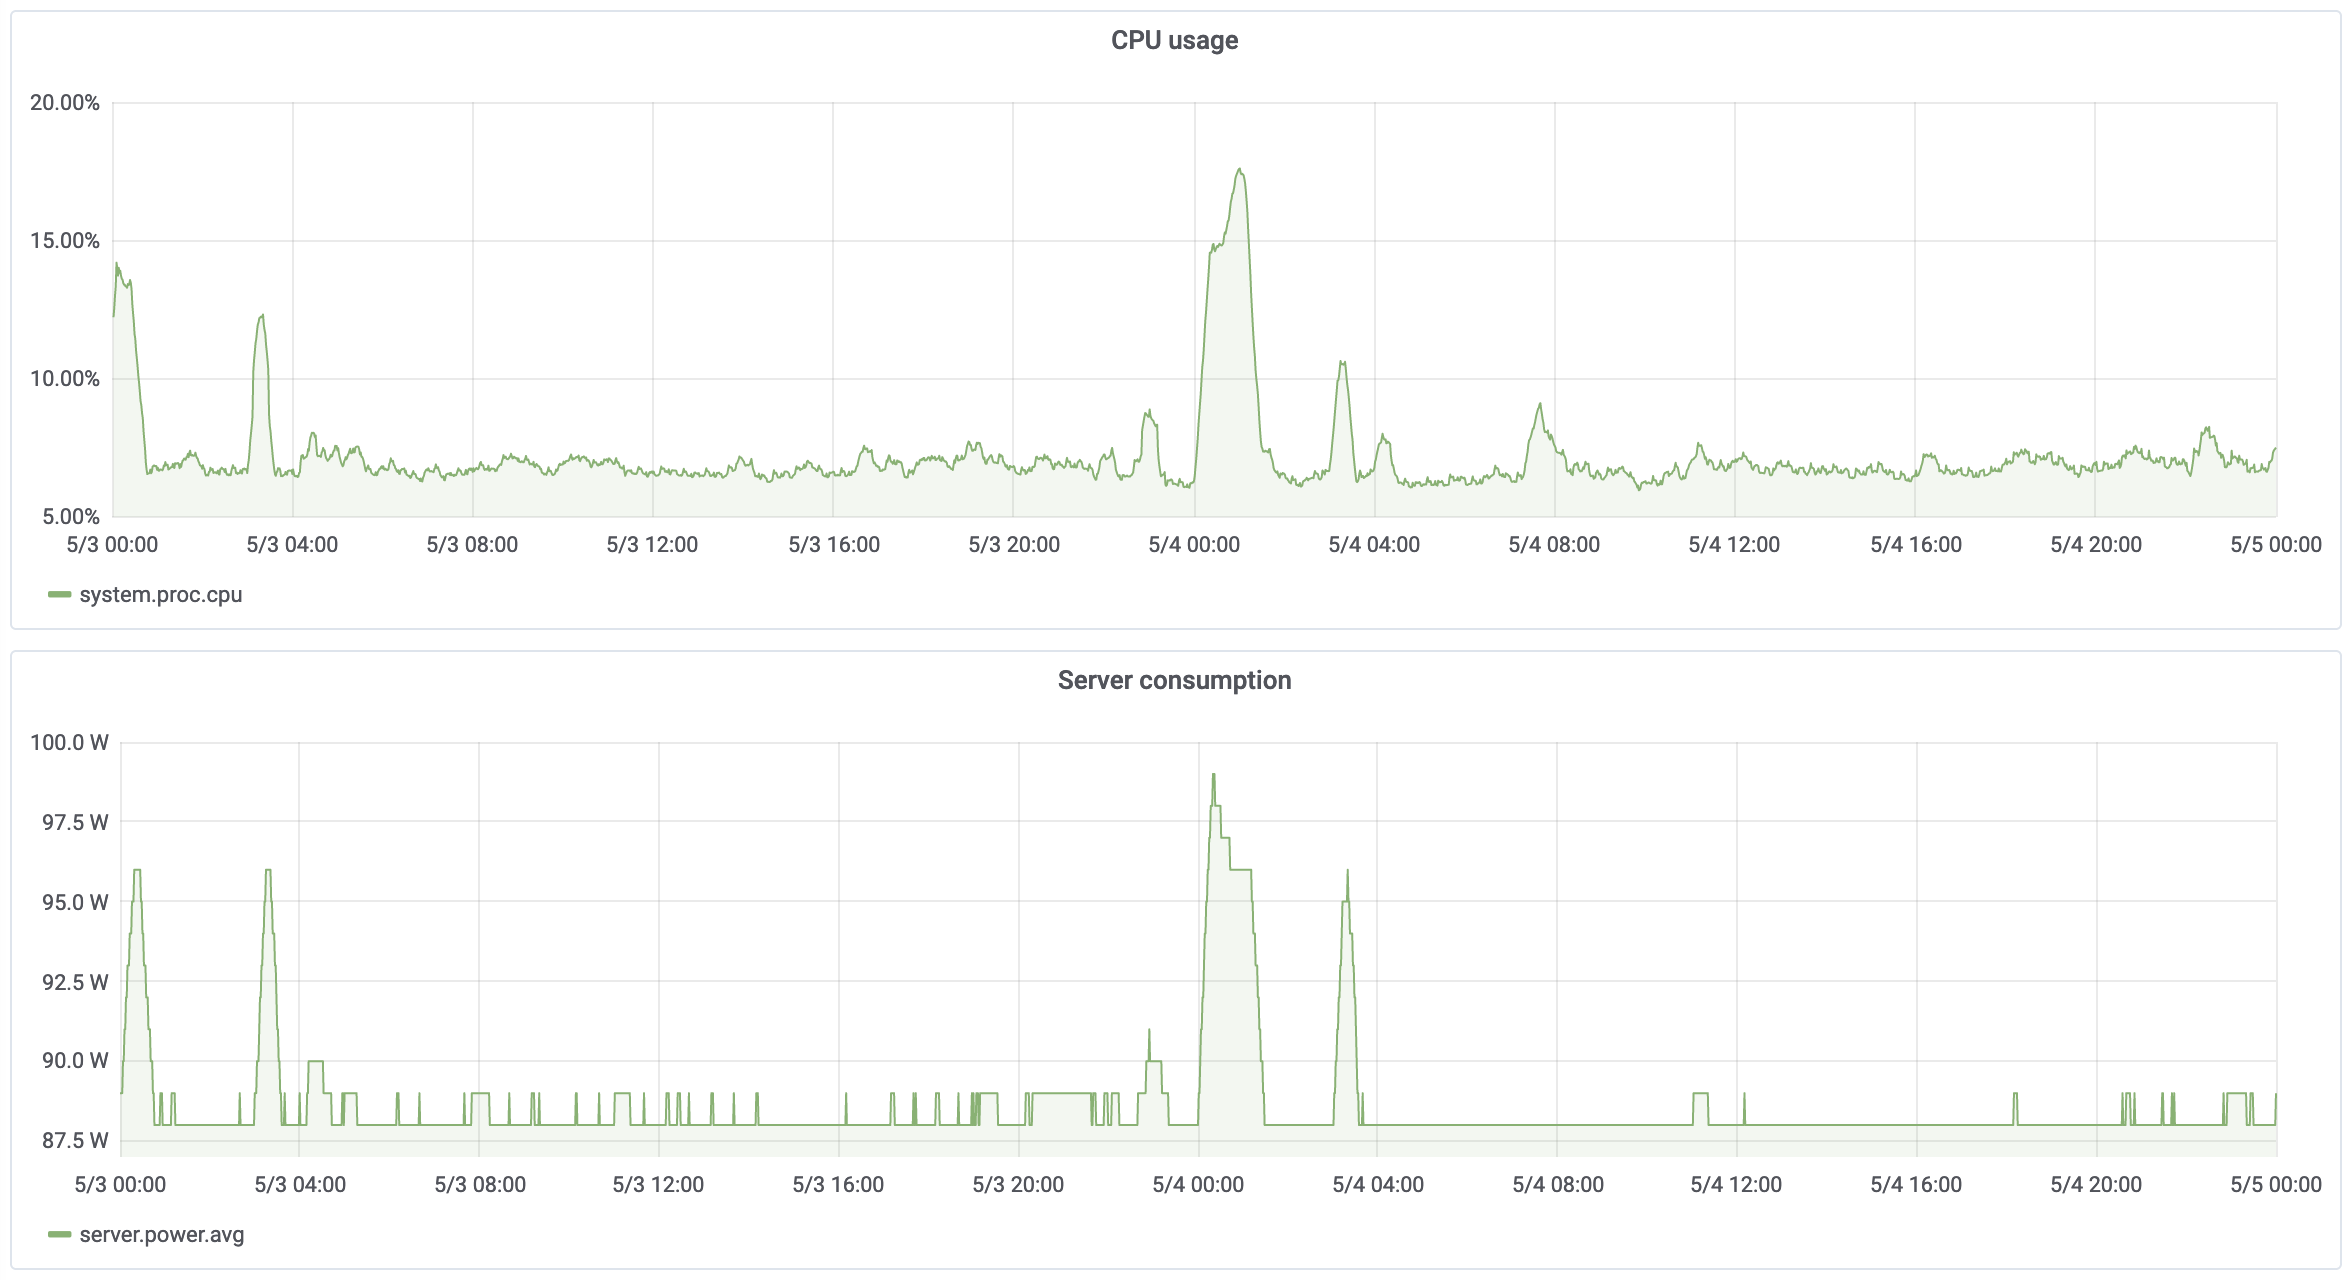
First, we wanted to find a correlation between CPU usage and power consumption for our servers. And it definitely looked like one! With around 500 000 datapoints (a piece of cake for Warp 10), we got an affine correlation. But more importantly: we found that each server consumes approximately 77 watts of power by just being powered on. In France, for one year of usage, that’s approximately €100 each.
Now, we have a script that powers them off when they are not needed.
| Read more: Compare data hour to hour, day to day |
Conclusion
The ResEl is a small association with rather specific needs. Even though the WarpScript language may seem exotic at first glance, it was a real game-changer for us: useful data types, no more SQL-like queries, and a very good expressiveness.
Warp 10 has given us a better understanding of the weak points in our infrastructure and allows us to respond more quickly to our various incidents. We are eager to find new data to further improve the reliability of our services!
Read more
Introducing HFiles, cloud-native infinite storage for time series data
Speeding up your analytics with SHM
Warp 10 Accelerator - beyond fast!

System administrator
— Guest author —